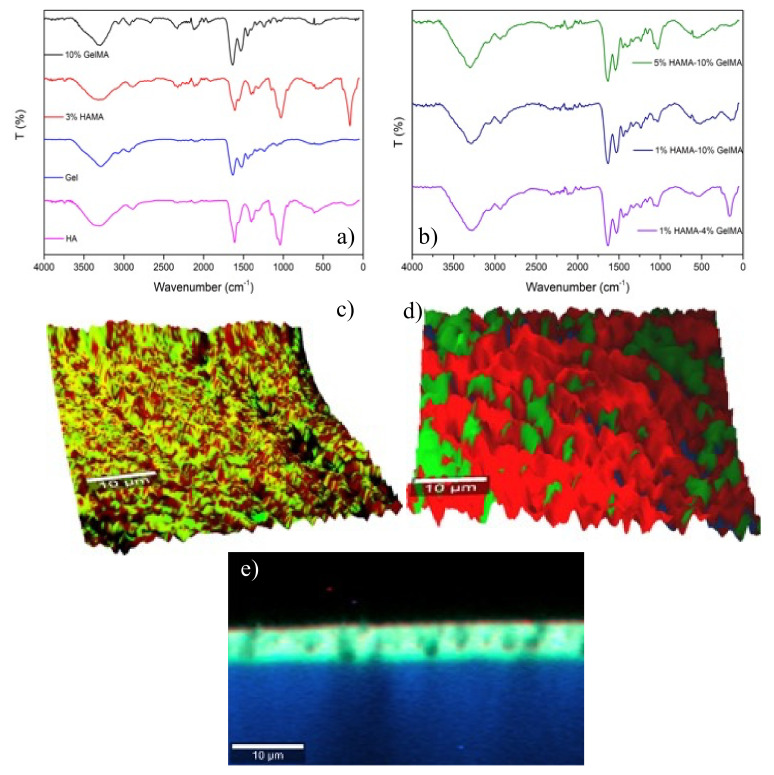
Figure 2.
(a,b) FTIR spectra of selected pure HAMA, GelMA, and hybrid GelMA/HAMA hydrogels at different compositions. Surface topographical composition acquired by Raman confocal 3D imaging of (c) 2% GelMA (green)-1% HAMA (red) and (d) 5% GelMA (red)-1% HAMA (green) hybrid hydrogels. HAMA was detected using bands at ca. 1380 and 1410 cm−1, whereas GelMA was detected using a band of ca. 1455 cm−1. (e) In-depth Raman imaging of the 2% GelMA-1% HAMA hydrogel. The bright blue-greenish color on the hydrogel in depth denotes the perfect mixing of HAMA (green) and GelMA (blue).

