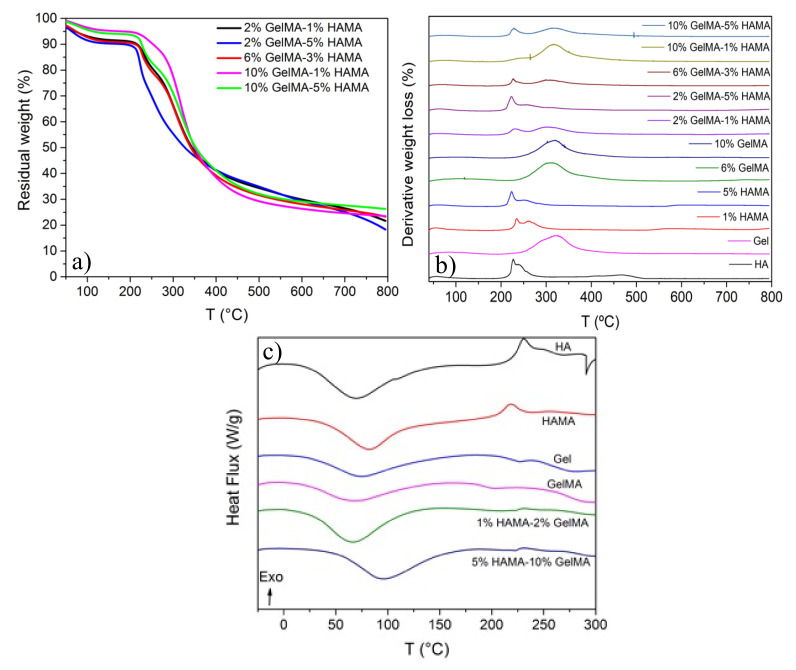
Figure 3.
TGA scans of (a) hybrid GelMA/HAMA hydrogel scaffolds at different concentrations; (b) first derivative plots of TGA data of different pure and hybrid hydrogels; (c) examples of DSC curves corresponding pure Gel, pure HA, pure GelMA, pure HAMA, and some hybrid GelMA/HAMA hydrogel scaffolds.

