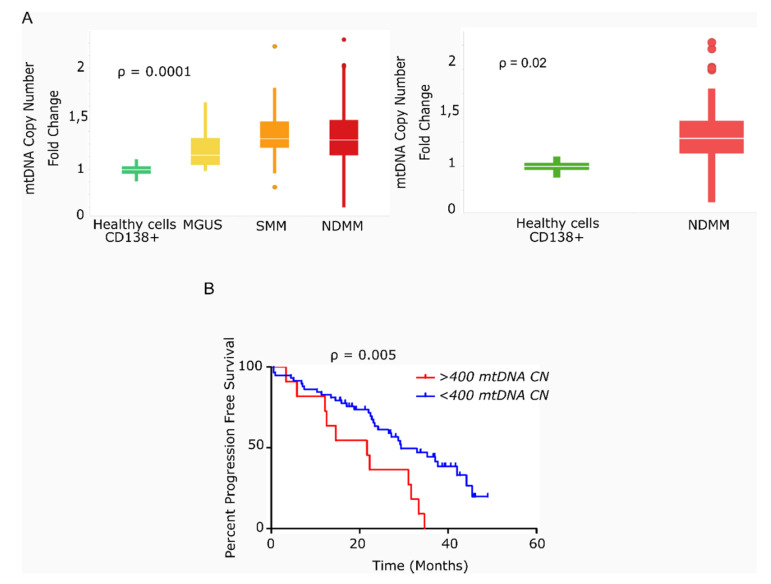
Figure 1.
Primary multiple myeloma cells exhibit differences in mitochondrial DNA copy number, which correlates with survival. (A) Box-plots of mtDNACN values estimated from next-generation sequencing data (n = 142). MM/ healthy donors mtDNACN fold-change (153 vs. 40 copies), p = 0.0001 (ANOVA Kruskal–Wallis test). Average mtDNACN of MM cells from patients with NDMM and healthy plasma cells (157 vs. 40 copies), p = 0.02 (Mann–Whitney test). Data are presented as mean values ± SD. (B) Kaplan–Meier curves of progression-free survival (PFS) in patients with MM. The red curve corresponds to patients with >400 mtDNA copies (n = 11). The blue curve corresponds to patients with <400 mtDNA copies (n = 58) (p = 0.005).

