Figure 2.
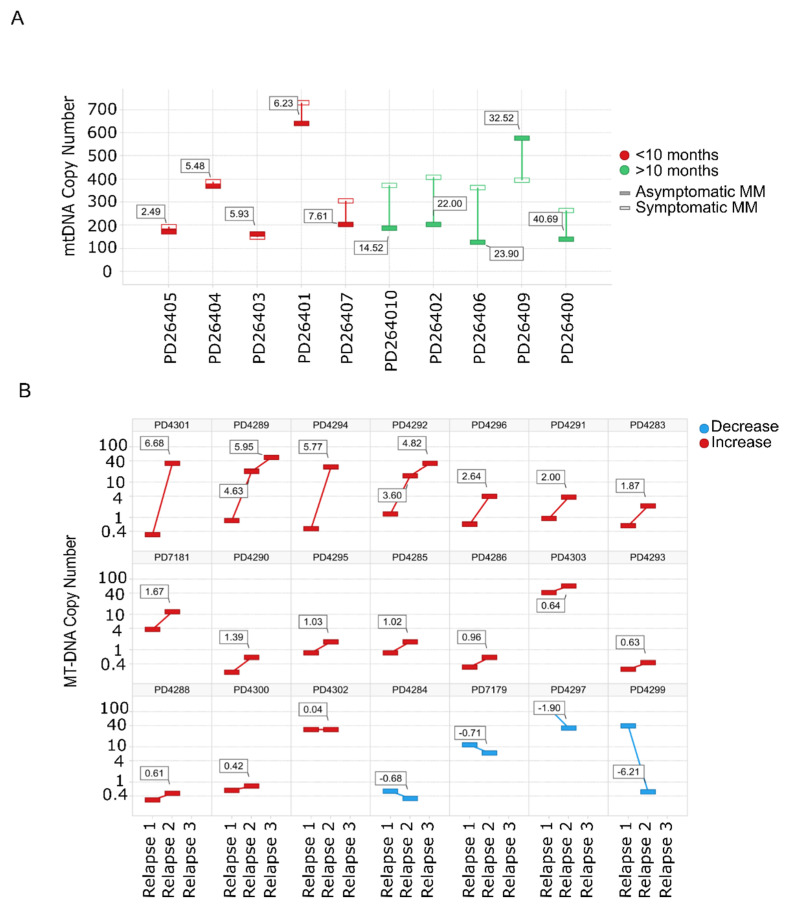
Mitochondrial DNA copy number increases with the progression of the disease. (A) mtDNACN calculated from WGS data from paired samples of 10 patients with SMM evolving to MM. Green bars correspond to patients with increased mtDNACN and red bars correspond to decreased mtDNACN, p < 0.05 (Mann–Whitney). (B) Changes in consecutive relapse patients were assessed from WES data of 21 patients (n = 44 samples), p < 0.05 (Kruskal–Wallis). Red bars correspond to the increase between the first and second or second and third relapses, whereas blue bars correspond to a decrease.

