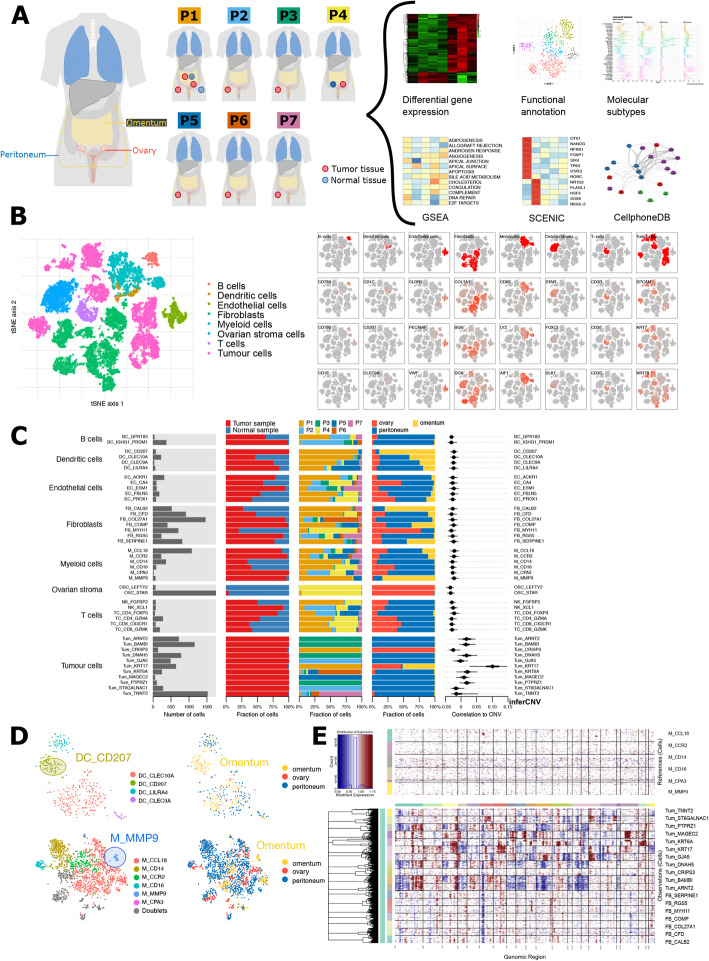
Fig. 1.
ScRNA-seq-based tumour microenvironment analysis of 18,403 single cells from 7 treatment-naive HGSTOC patients. A Schematic overview of the sampling site (ovary, omentum or peritoneum) and tissue type (normal or tumour tissue) of the 12 biopsies from seven treatment-naive patients as well as the analysis workflow. B t-SNE representation of all single cells colour-coded for their assigned major cell type (left) and for the expression of three marker genes used for this annotation as indicated on the top row. Marker genes: B cell (CD79A, IGHG3, IGKC), dendritic cells (CD1C, CD1A, CLEC9A), endothelial cells (CLDN5, PECAM1, VWF), fibroblasts (COL1A1, COL1A2, BGN), myeloid cells (CD68, LYZ, AIF1), ovarian stroma cells (STAR, FOXL2, DLK1), T cells (CD3D, CD3E, TRAG), epithelial cancer cells (EPCAM, PAX8, CD24). Dendritic cells remained co-clustered with myeloid cells in the first clustering step, but separated from myeloid cells before further subclustering based on established marker genes (CLEC9A, CD1C, CD1A). C Barplot showing for each of the 32 stromal and 11 cancer subclusters (from left to right) the number of cells, tissue type (normal or tumour), their distribution across the 7 patients, their distribution across sampling sites (ovary, omentum and peritoneum) and their correlation to the copy number alteration (CNA) profile of patient 1 using low-coverage whole-genome sequencing. D t-SNE visualisation of dendritic cell (up) and myeloid cells (down) subclusters containing tissue-specific cells enriched in the omentum, defined as Langerhans-like dendritic cells (DC_CD207) and lipid-associated macrophages (M_MMP9). E CNA profiles of fibroblasts compared to those from the tumour subclusters and monocyte subclusters using inferCNV confirming the CN stable profile of all fibroblast subclusters

