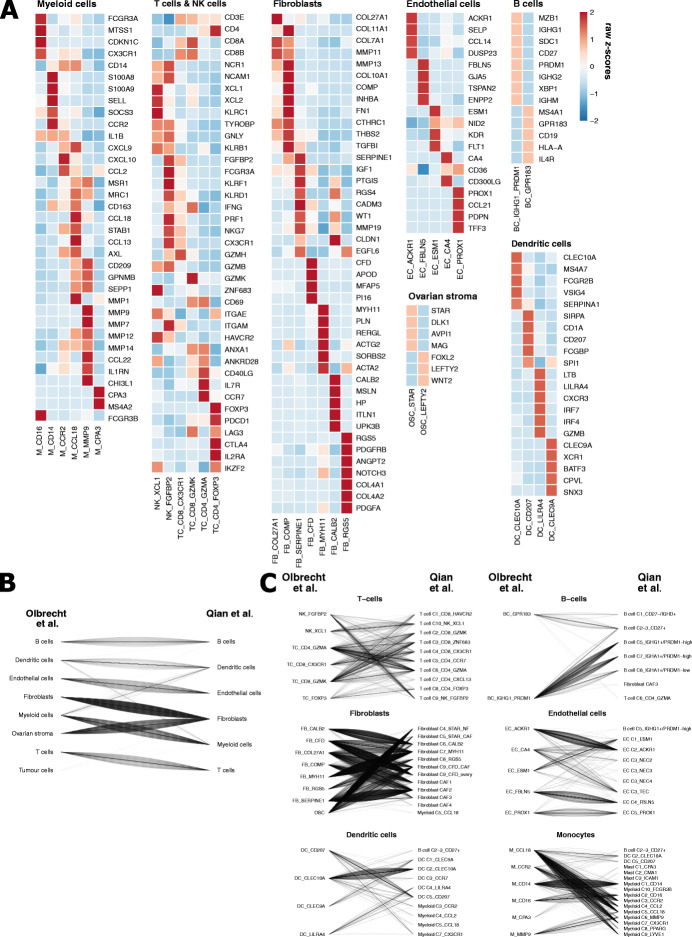
Fig. 2.
Comparative analysis of subcluster identification between this study and the pan-cancer blueprint. A Heatmap illustrating the expression of marker genes for cell type annotation as defined by Qian et al. [64] across all independently clustered myeloid cell, T cell, fibroblast, endothelial cell, B cell, ovarian stroma cell and dendritic cell subclusters. B, C Subgroup analysis comparing the major cell type (B) and cell subtype (C) annotation of 8595 cells from 4 patients included in both the pan-cancer blueprint. Line plots illustrate the correspondence of major cell type annotation (B) and phenotype annotation (C) independently attributed by our analysis (left) and Qian et al. [64] (right). One line represents one cell. As tumour cells were not annotated by Qian et al. [64], only the tumour cells being misclassified to stromal compartments were visualised

