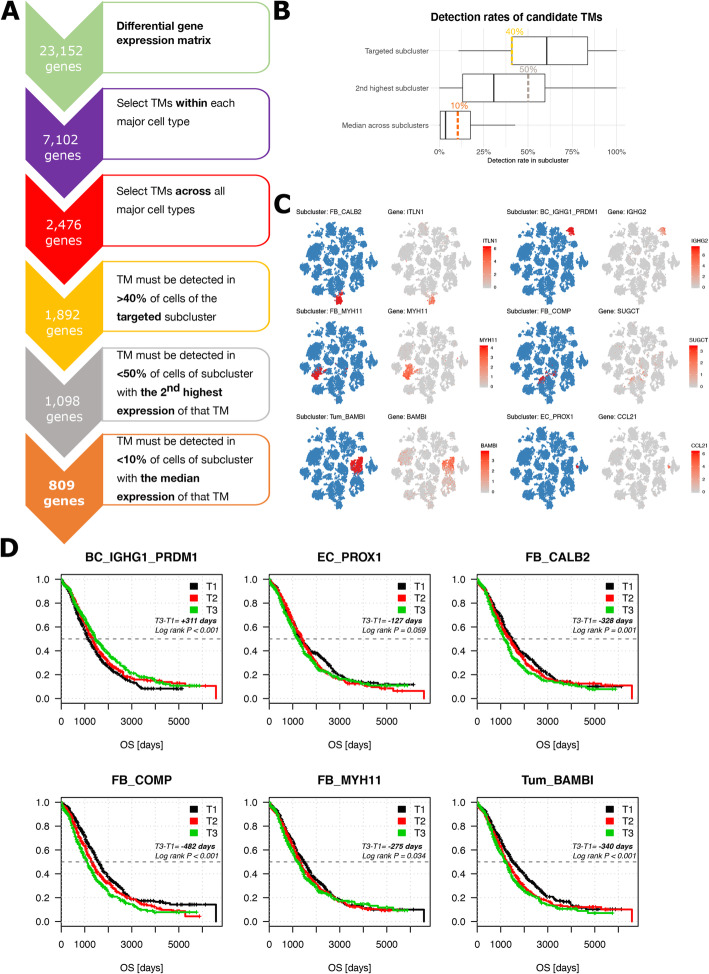
Fig. 3.
Transcriptomic markers (TMs): filtering strategy and effect on survival. A Flowchart illustrating the process used to select 809 TMs. B Boxplots illustrating the distribution of the detection rate of each candidate marker gene surviving the selection within and across the major cell types using the Wilcoxon rank sum test (see “Methods”). Shown are the detection rates of each candidate TMs in the targeted subcluster, in the subcluster with the 2nd highest expression of that TMs as well as the median detection rate across all subclusters. Cut-offs for further selection of appropriate TMs were arbitrarily chosen based on this distribution, eliminating all TMs with less than 40% detection rate in the targeted subcluster (yellow), more than 50% detection rate in the subcluster with the 2nd highest expression (grey) and more than 10% median expression across all subclusters (orange). C t-SNE of all 18,403 cells visualising the cells classified into the 6 prognostic subclusters based on PCA/CCA alignment on the blue t-SNE as well as the expression of a transcriptomic marker for each of these subclusters across all cells on the grey t-SNE, including IGHG2 for plasma cells (BC_IGHG1_PRDM1), CCL21 for lymphatic endothelial cells (EC_PROX1), MYH11 for myofibroblasts (FB_MYH11), ITLN1 for the mesothelial cells (FB_CALB2), SUGCT for the TGF-β-driven cancer-associated fibroblasts (FB_COMP) and BAMBI for the cancer cell subcluster Tum_BAMBI. D Kaplan-Meier curves for each of the six prognostic cell phenotypes stratifying 1467 patients from 6 public cohorts (TCGA [4], Bonome et al. [57], Tothill et al. [19], Bentink et al. [56], Ferriss et al. [58] and Konecny et al. [20]) in 3 artificial groups based on the presence of a SSZ score in the highest (> 66%, T3), medium (33–66%, T2) and lowest tertile (< 33%, T1) of SSZ scores across the whole dataset. Differences in survival time as well as the log-rank p values between group T3 and T1 are indicated. The patients still alive at the time of analysis were censored at the time they were last followed up. In contrast to the meta-analysis used to select these 6 prognostic cell phenotypes, the survival curves and the log-rank p values were unadjusted for covariates (age, FIGO stage, residual disease). As a consequence, lymphatic endothelial cells (EC_PROX1) lost their statistical significance (p = 0.059)

