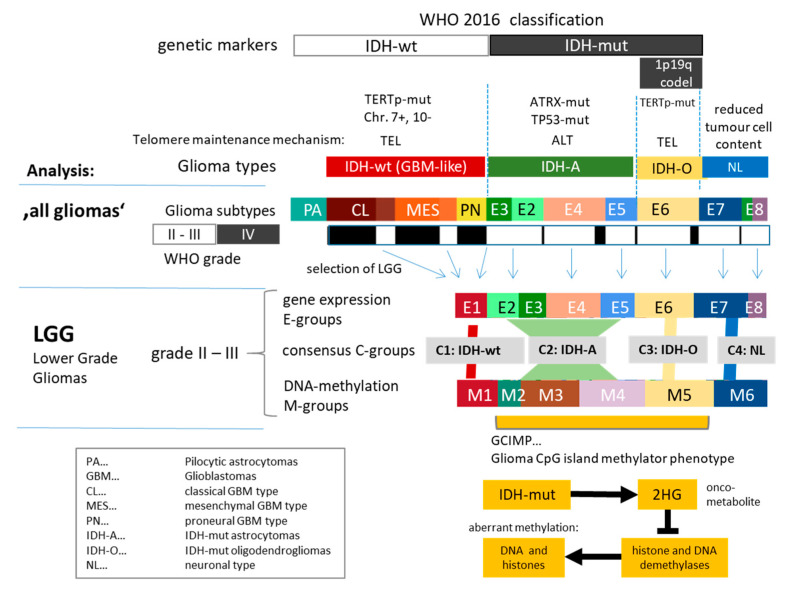
Figure 1.
Overview about glioma strata and of their analyses: ‘All glioma’ analysis comprises expression data of pilocytic astrocytomas and of grade II–IV gliomas (LGG and GBM), which were stratified as shown in the figure. Then, combined analysis of expression and DNA methylation data of LGG was performed in order to study the effect of DNA methylation on glioma biology. About 85% of LGG carry mutations in the IDH gene, which causes aberrant methylation of DNA and histone side chains via repression of demethylating enzymes by the onco-metabolite 2 hydroxy-glutamate (2HG). E-groups and M-groups of LGG were stratified strictly on the basis of gene expression and DNA methylation data, respectively (see [20]), which, in consequence, gives rise to only partly matched E- and M-groups as well as genetic WHO-classes based on IDH mutation and chromosome 1p and 19q co-deletion status. Abbreviations and color coding of the groups are used throughout the paper.

