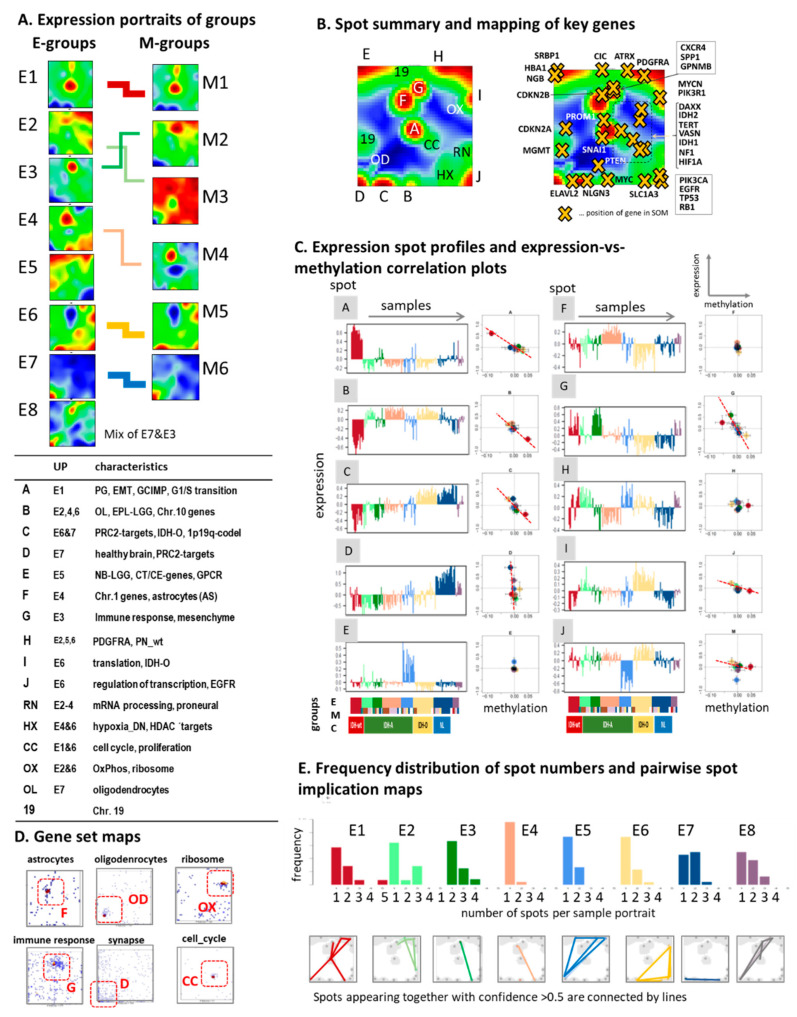
Figure 3.
Cartography of the LGG transcriptome. (A) Mean SOM expression portraits of the E-groups were specific for each class and revealed correspondence with the expression portraits of the M-groups. (B) The LGG transcriptomes divide into 10 major modules of co-expressed genes with (C) characteristic profiles and mostly negative correlation between group averaged expression and gene promoter methylation (the scatter plots show mean expression versus mean methylation averaged over all genes included in the spot and all gliomas per group). (D) The gene set maps plot genes of selected functional context into the expression landscape. Please note their accumulation in different areas, which were assigned to the spots introduced above. (E) The spot-number distribution estimates the degree of the heterogeneity of sample portraits in terms of expressed spot modules and the spot implication maps join spots frequently appearing together (confidence > 0.5) in each of the subtypes by lines.

