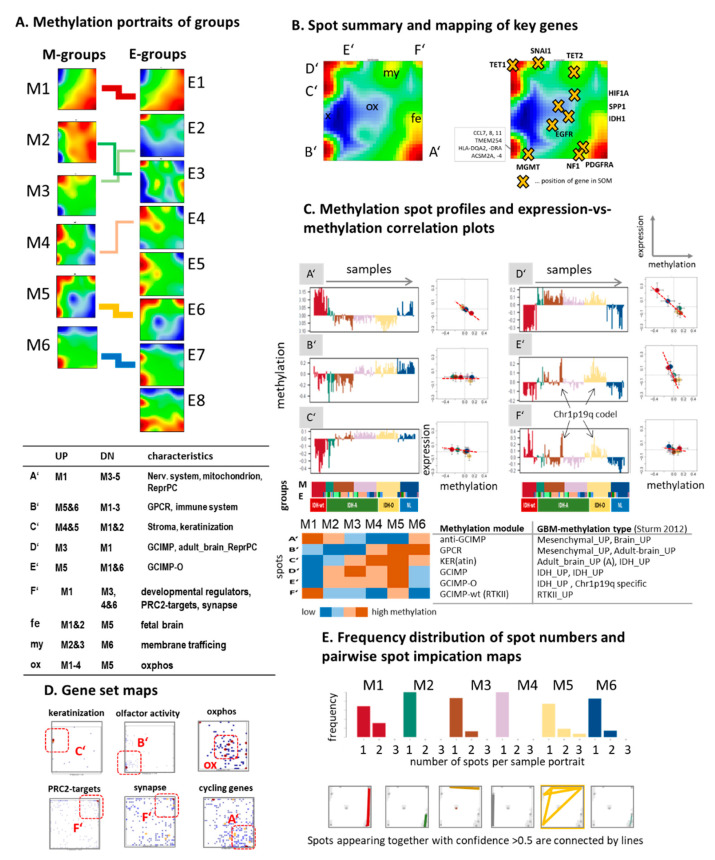
Figure 4.
Cartography of the LGG methylome: (A–E) subgroup portraits, spot summary map, spot profiles, and functions. See legend of Figure 3 for details. The heatmap in part C provides an overview about the methylation spot modules. They were named as follows: anti-GCIMP (spot A’), resembling the CpG-HypOmethylation module of IDH-mutated tumors (CHOP, [29]); GPCR-module (B’); KER-module (C’, keratinization); GCIMP module (D’); GCIMP with specific hypermethylation of IDH-O (GCIMP-O, E’); and hypermethylation of IDH-wt, particularly of the RTK II type (GCIMP-wt, F’) [9]. The spots enrich selected GBM methylation signatures according to [9], which were taken from [29].

