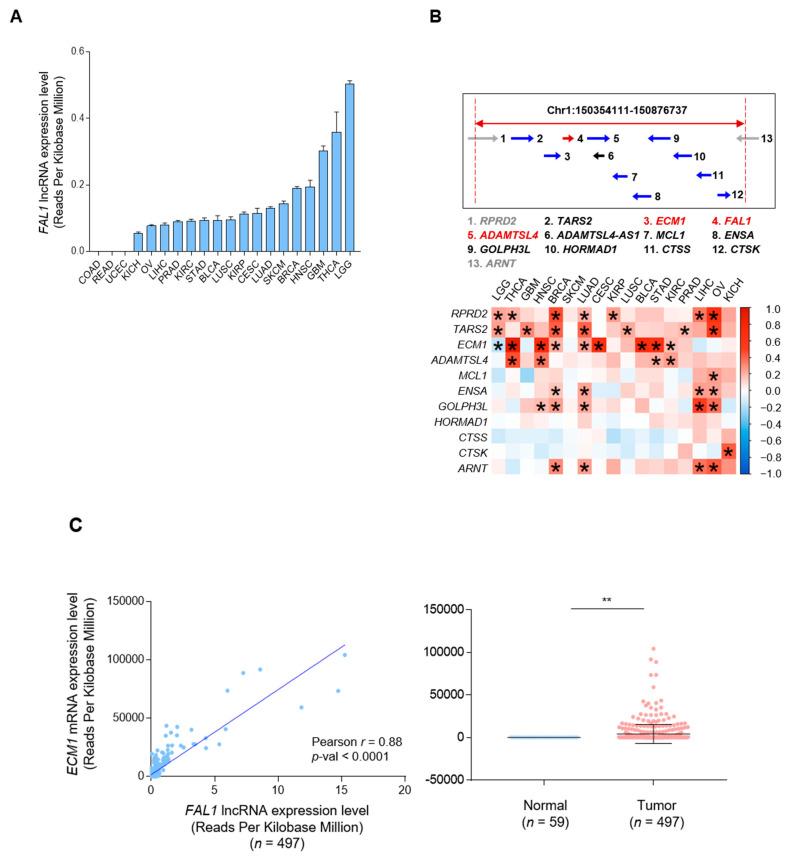
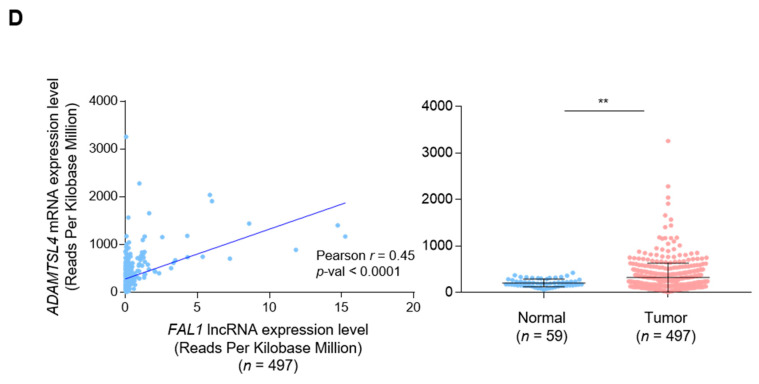
Figure 1.
(A) Positive correlation of FAL1 expression with the expression of neighbouring genes adjacently located on chromosome 1q21.3. A. FAL1 expression status of 20 types of human cancers. (B) Location of FAL1 and neighbouring genes on chromosome 1q21.3 and correlation status of FAL1 with neighbouring genes in terms of expression in 17 human cancers. (C) Positive correlation of FAL1 expression and ECM1 expression, and upregulated expression of ECM1 in tumour samples compared to that in normal tissues in THCA. (D) Positive correlation of FAL1 expression with ADAMTSL4 expression and upregulated expression of ADAMTSL4 in tumour samples compared to that in normal tissues in THCA. Abbreviations: FAL1, focally amplified lncRNA on chromosome 1; RPRD2, regulation of nuclear pre-MRNA domain-containing 2; TARS2, threonyl-tRNA synthetase 2, mitochondrial; ECM1, extracellular matrix protein 1; ADAMTSL4-AS1, ADAMTSL4 antisense RNA 1; MCL1, myeloid cell leukaemia 1; ENSA, endosulfine alpha; GOLPH3L, Golgi phosphoprotein 3-like; HORMAD1, HORMA domain-containing 1; CTSS, cathepsin S; CTSK, cathepsin K; ARNT, aryl hydrocarbon receptor nuclear translocator. The arrows indicate the direction of transcription. Average values were compared using an unpaired t-test. In the scatter plots, data are expressed as the mean ± SD. Correlation coefficient: Pearson’s r. * p < 0.05, ** p < 0.01. All p-values are two-sided.


