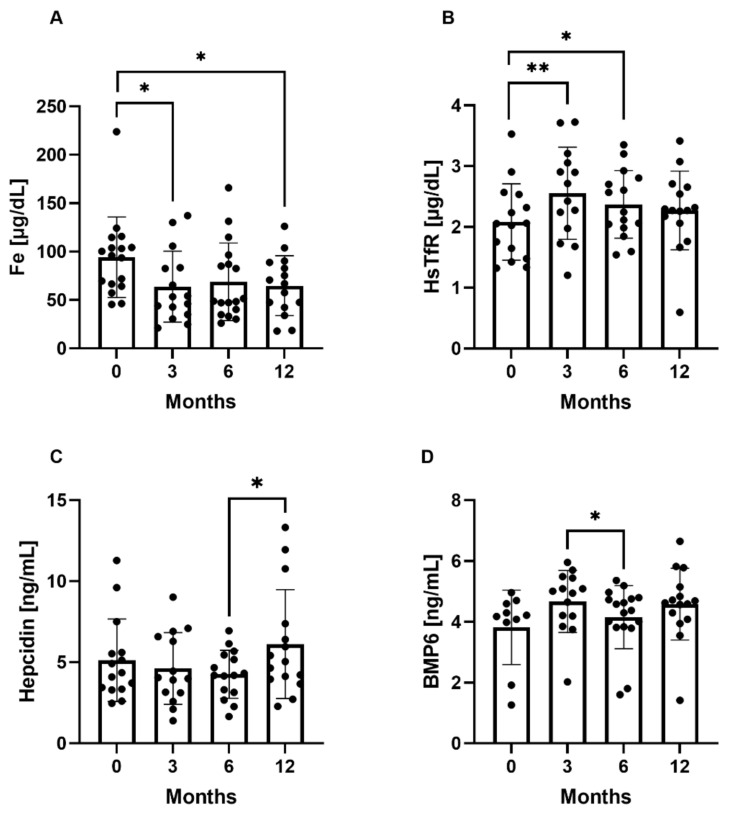
Figure 2.
Iron homeostasis parameters at the study time points. (A) Mean iron (Fe) concentration at the study time points. (B) Mean human soluble transferrin receptor (HsTfR) at the study time points, (C) Mean hepcidin concentration at the study time points. (D) Mean bone morphogenetic protein-6 (BMP-6) concentration at the study time points. * p < 0.05, ** p < 0.01 (paired t-test).

