Figure 1.
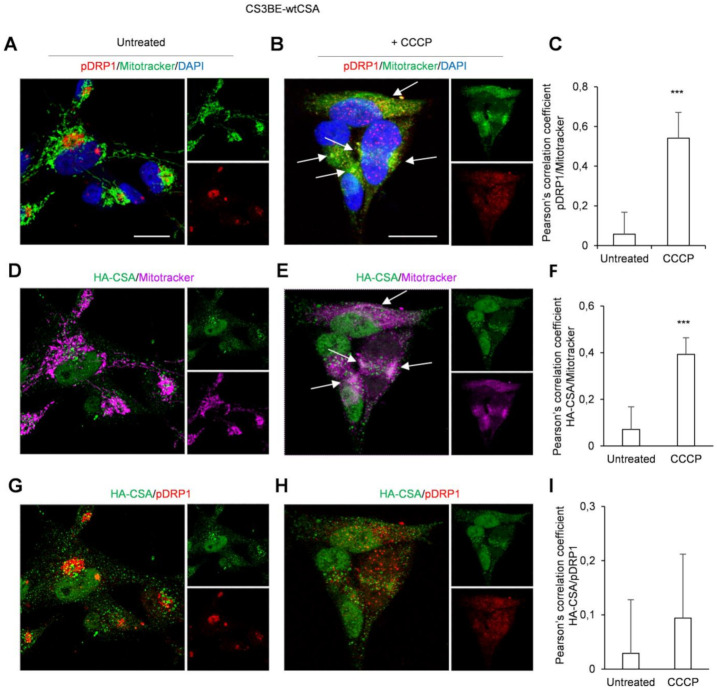
CSA and pDRP1 recruitment to mitochondria after CCCP treatment in CS3BE-wtCSA cells CLSM examinations of CS3BE-wtCSA cells in the absence (A,D,G) or in the presence (B,E,H) of CCCP for 16 h. Living cells were stained with Mitotracker® Deep Red FM (detected in green or magenta), fixed, permeabilized and labelled for pDRP1 (detected in red) and HA-CSA (green) expression. DAPI was used to stain nuclei (blue). Merged images of pDRP1/Mitotracker (A,B), HA-CSA/Mitotracker (D,E) and pDRP1/HA-CSA (G,H) are reported and insets represent separate channel images. Arrows indicate intracellular compartments where colocalizations of reported molecules are observed (colocalizations are detected in yellow or white). Scale bars, 20 µm. Images are representative of three independent experiments. Quantification of colocalization of pDRP1 with mitochondria (C) or HA-CSA with mitochondria (F) and of HA-CSA with pDRP1 (I) after cell treatment with CCCP, as determined by Pearson’s correlation coefficient measured in all microscopy images (mean ± SD). *** p < 0.0001, by Mann-Whitney test.

