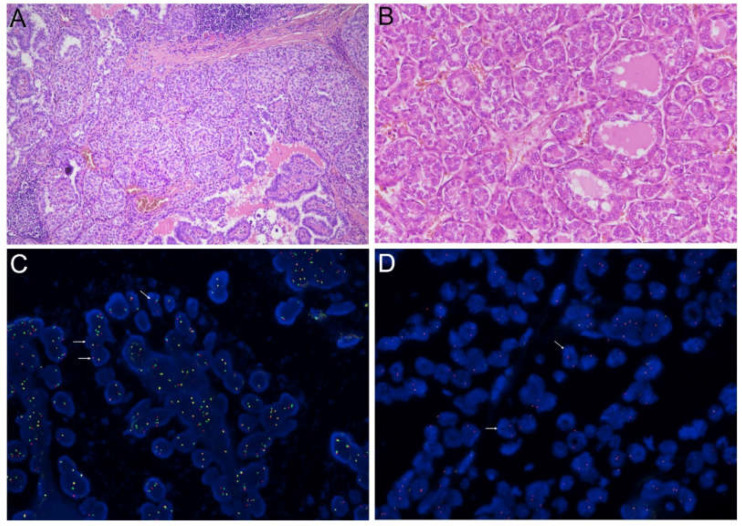
Figure 2.
Microscopic images showing histological details and FISH analysis of two PTCs. (A) C-PTC with solid areas positive for NTRK3 fusion (hematoxylin and eosin staining, original magnification 10×); (B) detail of follicular growth areas of an ALK-positive C-PTC (hematoxylin and eosin staining, original magnification 20×); corresponding FISH analyses of NTRK3 and ALK are shown in (C) and (D), respectively. White arrows indicate examples of positive nuclei.

