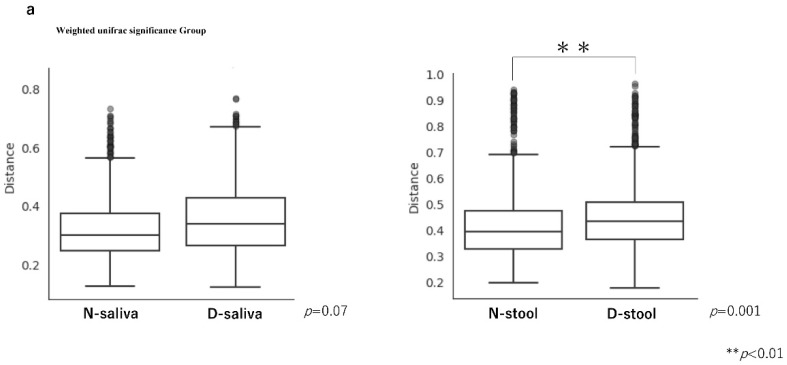
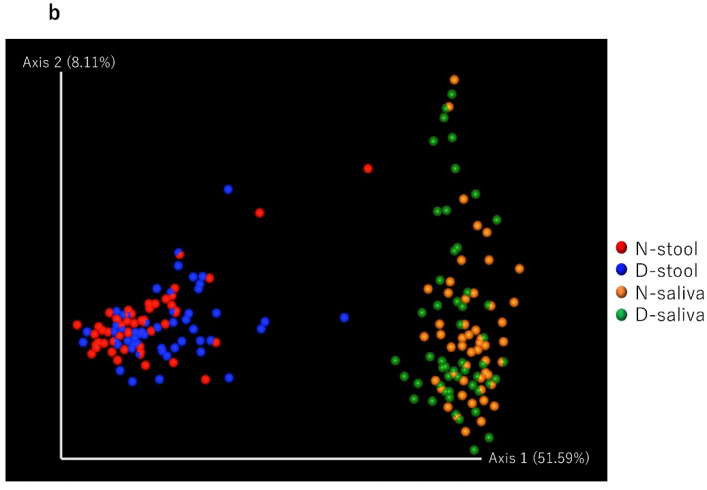
Figure 2.
Diversity analysis. (a) Although β diversity was not significantly different in saliva samples between controls and patients with CRC, it was significantly different in stool samples between the groups. The significance test was evaluated using permutational multivariant analysis of variance (PERMANOVA). (b) Principal coordinate analysis (PCoA) plots based on weighted UniFrac distance analysis of the microbiota in each sample. Closer plots indicate a more similar microbiota composition. Axis 1 and Axis 2 indicate the percentage of variation explained by principal coordinates.


