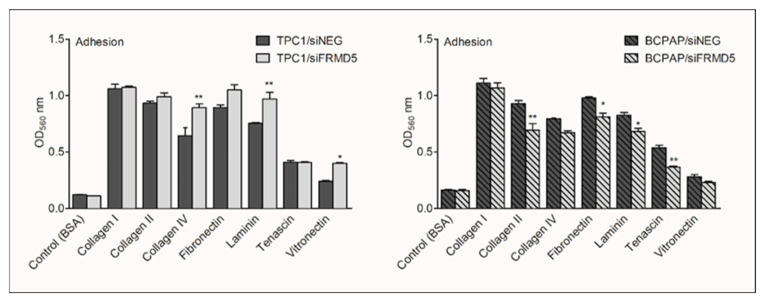
Figure 7.
FRMD5-knockdown affects cell-extracellular matrix (ECM) interactions of TPC1 and BCPAP cells. The left and right panel shows adhesion assay performed on TPC1 and BCPAP cells, respectively. Data are expressed as optical density (OD560), which refers to the number of attached cells. The graphs present the fraction of attached cells to collagen I-, collagen II-, collagen IV-, fibronectin-, laminin-, tenascin-, and vitronectin-coated wells. Bovine serum albumin (BSA)-coated wells served as a negative control. Gray bars mark FRMD5-silenced cells, and dark-color bars indicate cells treated with control siRNA (siNEG). Data are presented as mean ± SD. * p < 0.05; ** p < 0.001.

