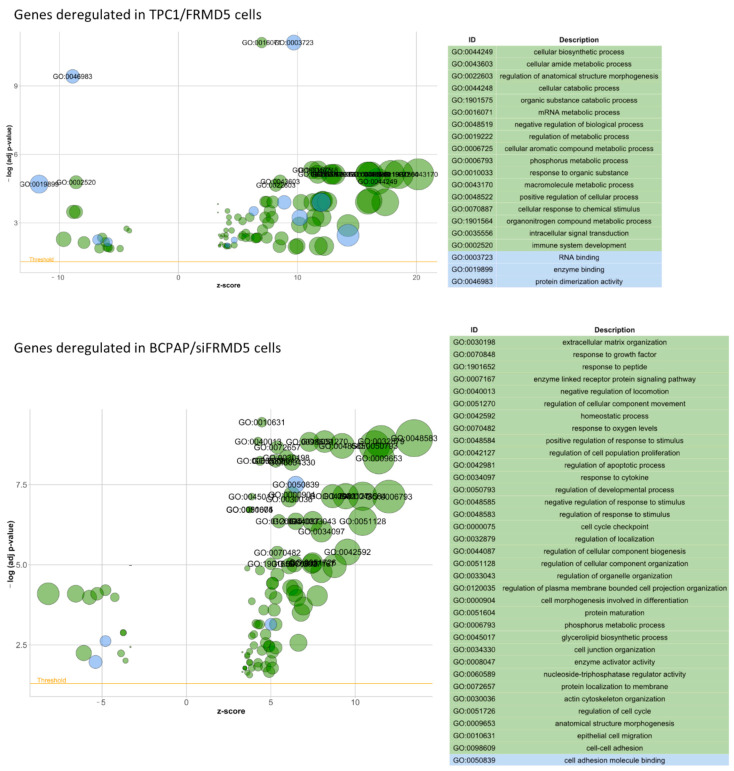
Figure 12.
Bubble plots of significantly enriched Gene Ontology (GO) terms for the FRMD5-depleted TPC1 (top panel) and BCPAP (bottom panel) cells after term similarity reduction. Terms with adjusted p-value on the PHRED scale higher than 4 (TPC1) and 5 (BCPAP) are annotated. The area of the circles is proportional to the number of genes assigned to the term in the analysis. The z-score (horizontal axis) indicates whether the given term is more likely to be up- or downregulated. The threshold indicates the adjusted p < 0.05.

