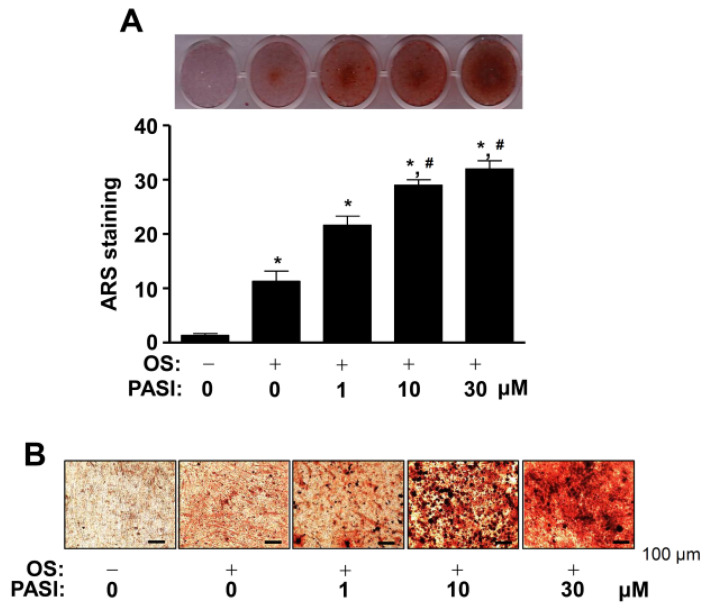
Figure 4.
Effects of PASI on the staining of ARS during late osteoblast differentiation. (A) The staining of ARS was visualized using a scanner (upper). The quantification of ARS stains was analyzed by using a spectrophotometer and exhibited as a bar graph (bottom). (B) The formation of the nodules was detected under a light microscope. Data are expressed as the mean ± S.E.M. of experiments. * p < 0.05, # p < 0.05 indicate a statistically significant difference compared to the control and OS, respectively.

