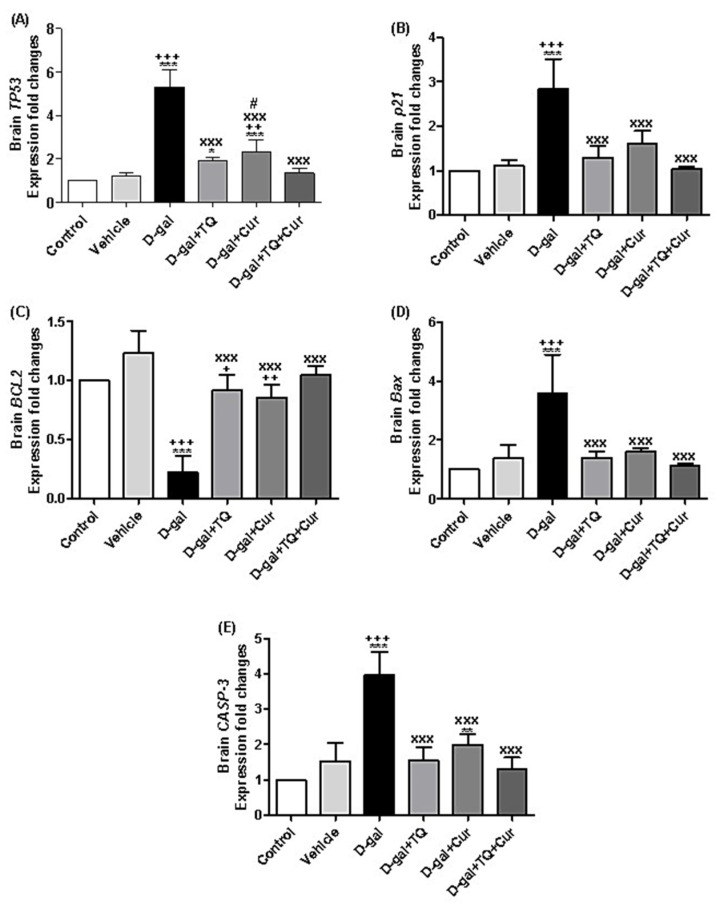
Figure 11.
Expression of fold changes of brain (A) TP53, (B) p21, (C) BCL2, (D) Bax, and (E) CASP-3. Data were analyzed with one-way ANOVA, followed by Tukey’s multiple comparison test. * p < 0.05, ** p < 0.01, and *** p < 0.001 vs. control. + p < 0.05, ++ p < 0.01, and +++ p < 0.001 vs. vehicle. xxx p < 0.001 vs. D-gal. # p < 0.05 vs. D-gal+TQ+Cur. Error bars represent mean ± SD. n = 5.

