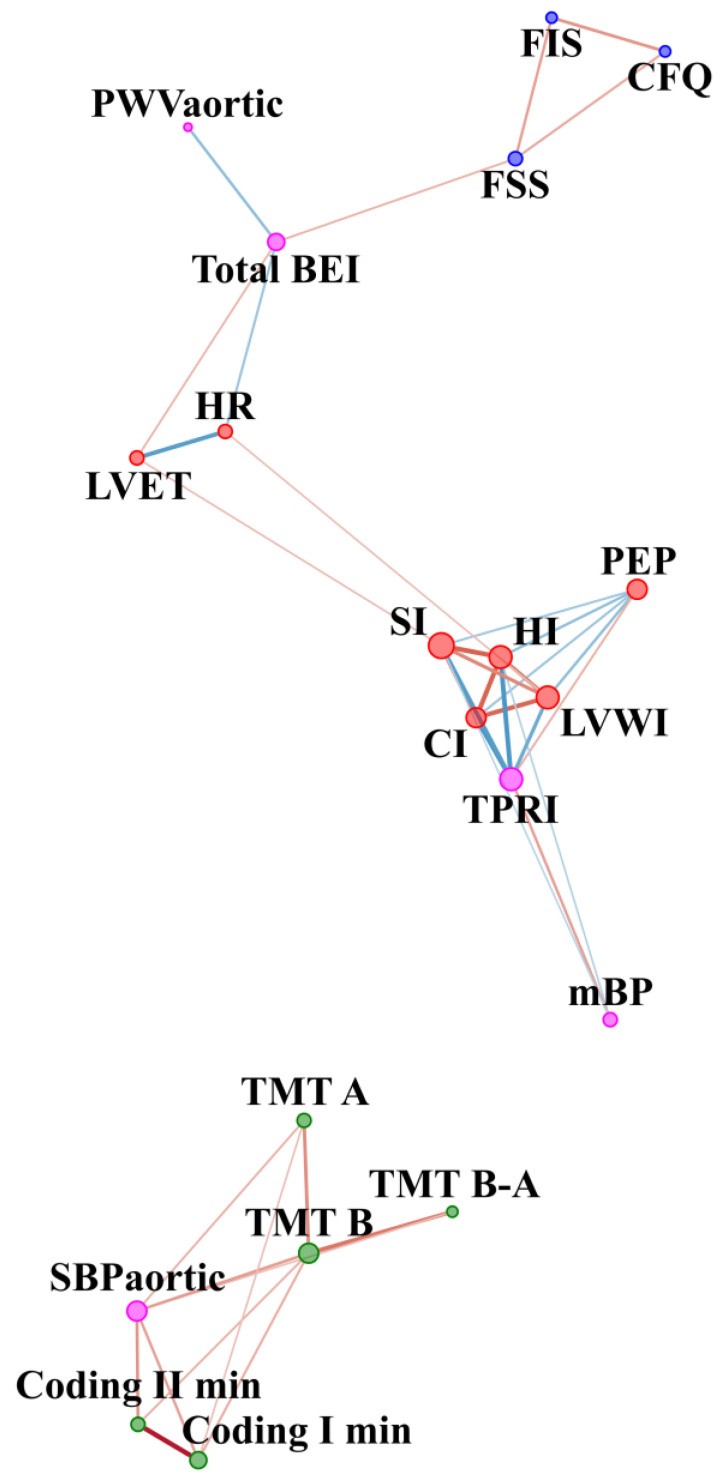
Figure 4.
Network analysis in CFS patients before WBC and SS therapy. The variables were grouped according to categories illustrated by colour of nodes: cognitive function (green), fatigue scales (blue), vascular system function (magenta) and cardiac muscle function (red). The size of the dots next to the variable names is continuously related to the number of statistically significant correlation coefficients with other variables. The colour of edges denotes the sign of correlation: blue indicate negative, while red indicates positive correlation. Edge width and intensity of colour denote strength of relationship. CFQ—Chronic Fatigue Scale, FSS—Fatigue Severity Scale, FIS—Fatigue Impact Scale, HR—Hear Rate, SI—Stroke Index, HI—Heather index, PEP—Pre-ejection period, LVET—Left Ventricular Ejection Time, CI—Cardiac Index, LVWI—Left Ventricle Work Index, TPRI—Total Peripheral Resistance Index, mBP—Mean Blood Pressure, PWVaortic—Aortic Pulse Wave Velocity, SBPaortic—central systolic blood pressure, Total BEI—baroreceptor effectiveness index, TMT A—Trial Making Test part A, TMT B—Trial Making Test part B, TMT B-A—Difference in result between TMT B and TMT A, Coding I—number of words left after first minute of coding test; Coding II—number of words left after second minute of coding test.

