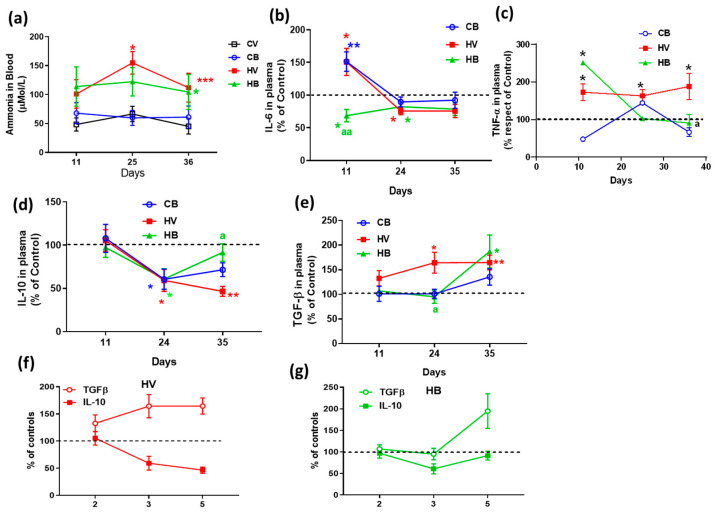
Figure 1.
Effect of bicuculline on ammonia in blood and peripheral markers of inflammation. (a) Ammonia concentration in the blood. (b) Time course of IL-6 levels in the plasma. (c) TNFα levels in the plasma after five weeks of hyperammonemia, expressed as percentage of controls. (d) Time course of plasmatic IL-10 levels. (e) Time course of TGF-β levels in plasma. Cytokine levels are expressed as a percentage of controls. (f,g) The time course of change in IL-10 and TGF-β plasmatic levels in hyperammonemic rats without (f) and with bicuculline treatment (g). Values are the mean ± SEM of 18–22 rats/group for ammonia, 5–7 rats for IL6, 6–9 rats for TNFα, 7–10 rats for IL-10, and 6–10 rats for TGF-β. Values significantly different from the control rats are indicated by asterisks. * p < 0.05; ** p < 0.01; *** p < 0.001. Values significantly different from hyperammonemic rats are indicated by “a”. a, p < 0.05, and aa, p < 0.01. CV, control vehicle; CB, control treated with bicuculline; HA, hyperammonemic rats with vehicle; HB, hyperammonemic rats treated with bicuculline.

