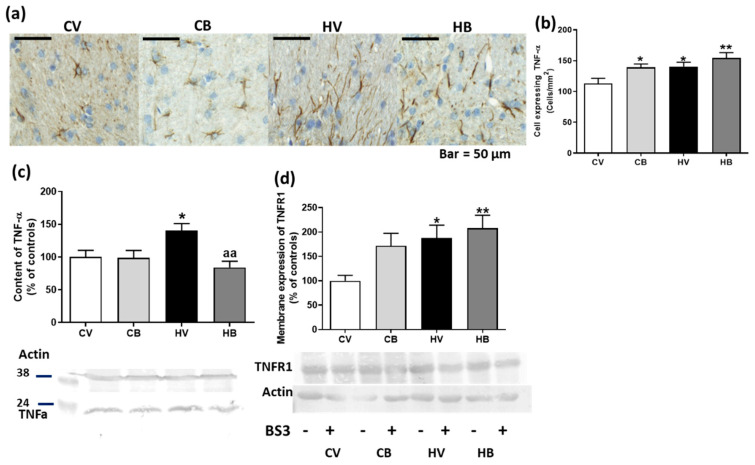
Figure 5.
Effect of bicuculline on the content of TNFα and membrane expression of TNFR1 in the cerebellum. Immunohistochemistry was performed using the antibody against TNFα. Representative images of TNFα staining in the white matter of the cerebellum are shown in (a). The number of cells expressing TNFα was quantified. Data are the mean ± SEM of three rats per group (b). The content of TNFα was also analyzed by Western blot in the total cerebellum (c), along with the membrane expression of TNFR1 (d). Values are the mean ± SEM of 10–12 samples per group. Values significantly different from control rats are indicated by asterisks: * p < 0.05, ** p < 0.01. Values significantly different from hyperammonemic rats are indicated by “aa”, p < 0.01. CV, control vehicle; CB, control treated with bicuculline; HV, hyperammonemic rats with vehicle; HB, hyperammonemic rats treated with bicuculline.

