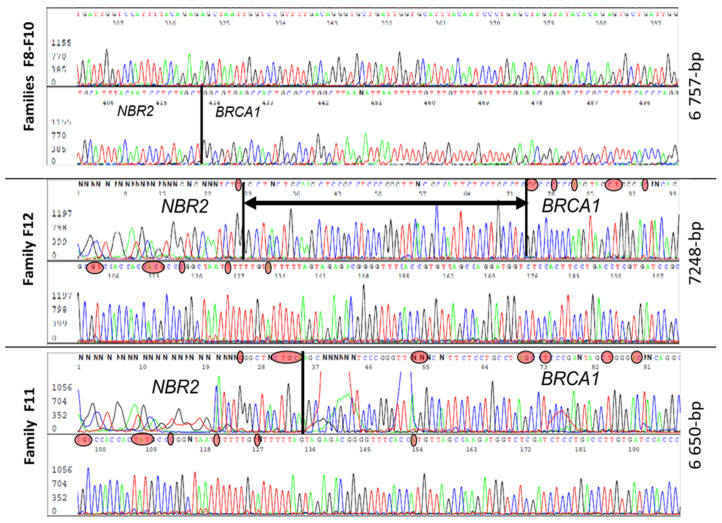
Figure 4.
Sanger sequences analysis of three different 5–10 kb deletions with very close breakpoints harbored by individuals from five unrelated families. In red circles are nucleotides specific to the BRCA1 and NBR2 genes. The black vertical line is the breakpoint position and the horizontal line with arrows is a common region in which there is a breakpoint.

