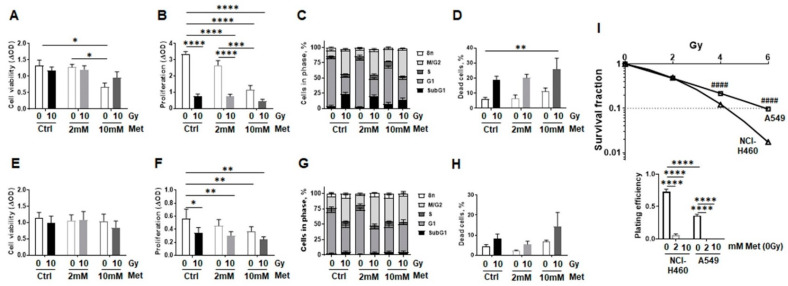
Figure 8.
Metformin treatment reduces malignant lung epithelial cell proliferation and survival following RT. Non-small cell lung cancer cells (NSCLC; NCI-H460: human epithelial large cell lung carcinoma; (A–D) and A549: human alveolar basal epithelial adenocarcinoma; (E–H)) were cultured in normal growth media supplemented with metformin (2 and 10 mM) or vehicle control (Ctrl) 2 h prior radiation treatment with 0Gy or 10Gy. Cell viability (A,E) cellular proliferation (B,F), cell cycle distributions (C,G), and cell death induction (D,H) were analyzed 96 h after the treatments. (A,E) Cell viability measurements as determined by metabolic activity using the WST-1 reagent are summarized as mean values ±SEM of 4–5 experiments, with seven replicates each. (B,F) Cellular proliferation was analyzed by crystal violet staining. Data are presented as mean values ±SEM of 5 independent experiments. p-values indicate * p ≤ 0.05, ** p ≤ 0.01, *** p ≤ 0.001, **** p ≤ 0.0001 by two-way ANOVA with Tukey’s multiple comparison test. (C,G) Respective cell cycle analysis at that time point were estimated following Nicoletti staining. Data were summarized as mean values ±SEM of 5–7 independent experiments. (D,H) Total cell death levels were determined by propidium iodide exclusion staining using flow cytometry. Data are summarized as mean values of 3–5 independent experiments. p-value indicate ** p ≤ 0.01 by two-way ANOVA with Tukey’s multiple comparison test. (I) Clonogenic survival was evaluated in metformin treated (0, 2, 10 mM) and irradiated (0, 2, 4, 6 Gy) NCI-H460 and A549 cells, 10 days post treatment. Coomassie stained colonies were quantified and respective surviving fractions from 3 independent experiments (means ±SEM), plated in triplicates each, were depicted. As metformin treatment dramatically reduced the plating efficiency of both NSCLC cells in a concentration-dependent manner, no colonies could be quantified here. Statistics were analyzed by unpaired (two-tailed) t-tests, comparing NCI-H460 cells to corresponding A549 cells.

