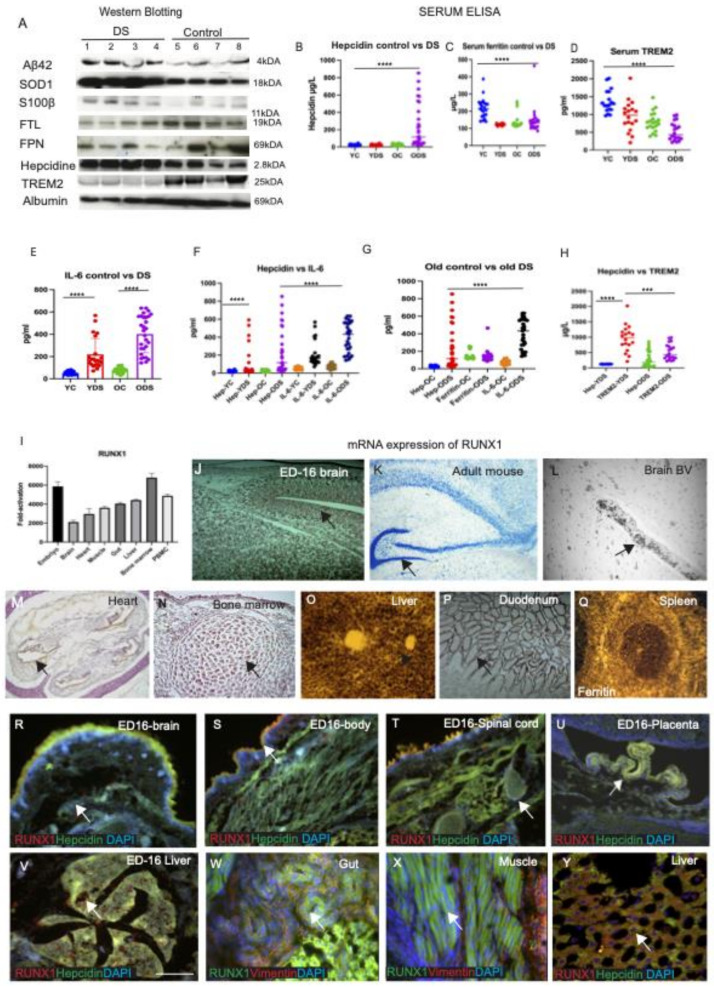
Figure 7.
Serum hepcidin and IL-6 could be involved in host defencemechanism in DS brain. RUNX1 mRNA expression was higher in the liver, bone marrow and duodenal endothelial cells, as assessed by in situ hybridisation. To investigate the effect of trisomy-21-related proteins (Aβ42, SOD1, S100β) and iron regulatory proteins (FTL, FPN, hepcidin), as well as inflammatory marker TREM2, on serum levels, a cohort of DS subjects (n = 18) and age-matched controls (n = 18) was analysed by Western blotting. Aβ42 (4 kDA) and S100β (11 kDA) levels were higher in the DS subjects compared to controls (Aβ42, p < 0.084, S100β p < 0.26, paired t-test, not significant) (Figure 7A and Supplementary Table S1). In contrast, SOD1 (18 kDA) level was found to be very high in DS serum (R2 = 0.64, p < 0.0007). However, FTL (19 kDA), FPN (69 kDA) and TREM2 (25 kDA) were significantly decreased in DS serum (p < 0.0001, p < 0.003 and p < 0.002, respectively) (Supplementary Table S1). Serum hepcidin was significantly higher in DS serum (p < 0.001) (A). Human serum from young and old DS (YDS, n = 23, and ODS, n = 24) and age-matched young and old control subjects (YC and OC, n = 25 in each group) were analysed by ELISA. Scattered plot showing the levels of serum hepcidin (B), ferritin (C), TREM2 (D) and IL-6 (E) (methods described in the main text and results were analysed by using one-way ANOVA that compared between groups, followed by Kruskal–Wallis or Bartlett’s test, corrected (Table 2), and a paired t-test, between YC vs. YDS and YC vs. OC, as shown in Supplementary Table S1). Serum ferritin was highest in controls (YC, 216.9 ± 171.1 μg/L, and OC, 211.43 ± 45.5μg/L) and lowest in the young DS (YDS, 122.56 ± 10.4 μg/L, compared to ODS, 139.83 ± 85.7 μg/L) (Figure 7C, R2 0.31, p < 0.0001, Table 2). Serum TREM2 levels were the highest in young controls (YC, 1190.91 ± 150.2 pg/mL, and OC, 796.26 ± 147.65 pg/mL) and the lowest in the old DS (YDS, 894.30 ± 201.52 pg/mL, and ODS, 562.79 ± 112.75 pg/mL, R2 0.48, p < 0.0001) (Figure 7D, Table 2). Serum IL-6 was higher in DS (YDS, 244.29 ± 144.4 μg/L, and ODS, 343.14 ± 320.1 μg/L) compared to both controls (YC, 52.62 ± 21.01 μg/L, and OC, 76.55 ± 31.4 μg/L, R2 0.63, p < 0.0001) (E). Serum hepcidin and IL-6 levels were both highest in the old DS subjects (R2 0.47, p < 0.0001 (F,G), Table 2). In contrast, serum TREM2 was higher in the controls compared to DS participants (R2 0.77, p < 0.0001 (H), Table 2). Statistical differences were calculated by Mann–Whitney U test. *** p < 0.001 and **** p < 0.0001. The RUNX1 mRNA expression pattern by RT-PCR, in wild-type mouse (C57/bl6) tissues from different tissues, is shown in the I. This analysis revealed low levels of mRNA in the brain with a slightly higher signal observed in the heart, skeletal muscle, gut, liver and with the highest expression seen in the bone marrow and peripheral mononuclear leukocytes (PBMC) (I). To identify cellular levels, tissues sections from embryonic (ED16) and adult mice were analysed by in situ hybridisation (ISH). Very high mRNA was visible in ED16 mouse brain, throughout the cortex and in the brain cavity (J), but less in the adult brain, being only visible in the HP and DG (K), and clearly in the brain blood vessels (in the blood cells) (L). However, higher mRNA expression was seen in the bone marrow, endothelial layer of the heart and duodenum (M,N,P). The highest mRNA level was seen in the liver (O). Adult spleen sections were hybridised with ferritin as a control probe, and strong mRNA was visible (Q). We analysed by IF, using RUNX1 and hepcidin antibodies and counterstained with DAPI for nuclei (blue). Both proteins were observed in the embryonic brain, in the ED16 body and spinal cord (R–T), with co-localisation in the epithelial cells of the placenta (U). RUNX1 was distinctly visible in the embryonic liver (V), endothelial cells of the gut and in the muscles (W,X), and co-localised with hepcidin in the adult liver hepatocytes (Y). Scale bar: (H,K–L) = 30 μm, (I,J) = 50 μm (M–O) = 100 μm, (P–Y) = 25 μm.

