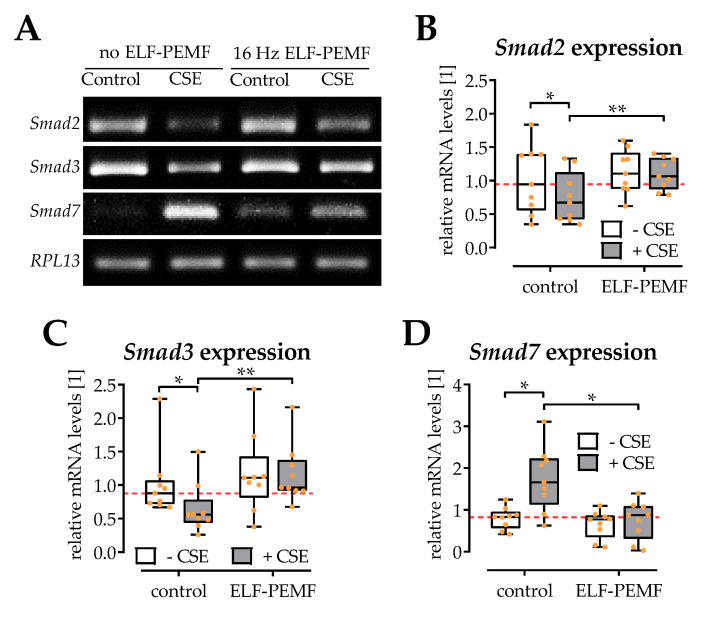
Figure 5.
Gene expression of Smads is affected by exposure to 5% cigarette smoke extract (CSE) and 16 Hz ELF-PEMFs for 30 min daily for 3 days. (A) Representative RT-PCR images. Signal intensities were quantified with the ImageJ software. Expression of (B) Smad2, (C) Smad3, and (D) Smad7 was normalized to RPL13 (house-keeping gene). N = 3, n = 3. Data are presented as box plots (Min to Max with single data points). Data were compared by non-parametric two-way ANOVA followed by Tukey’s multiple comparison test: * p < 0.05 and ** p < 0.01 as indicated.

