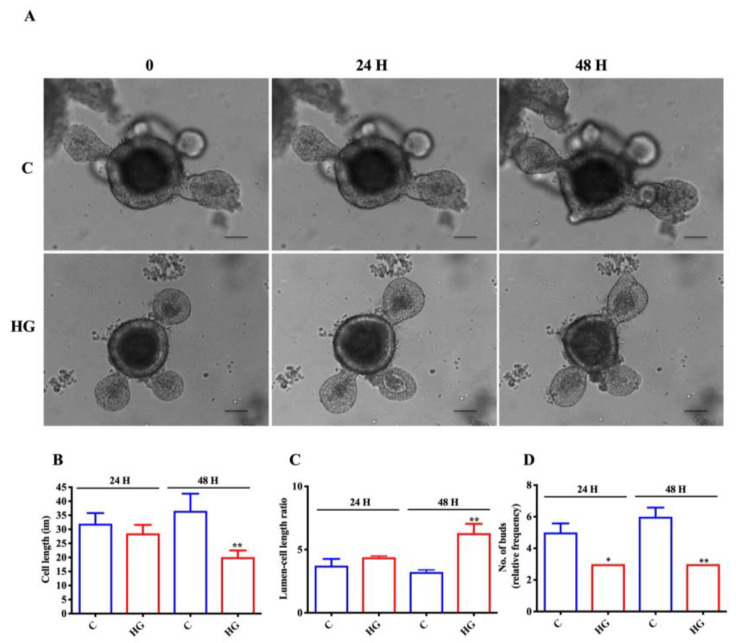
Figure 2.
Glucotoxicity affects intestinal organoid growth. (A) Representative brightfield images of intestinal organoids following 35 mM glucose exposure for 24 and 48 h. Cell length (B), lumen-cell length ratio (C), number of buds (D) in control, and treated organoids (n = 6). Scale bar, 50 μm. Data are expressed as means ± SEM. Unpaired Student t-test: * p < 0.05, ** p < 0.01. C = Control (17.5 mM glucose). HG = High Glucose (35 mM glucose).

