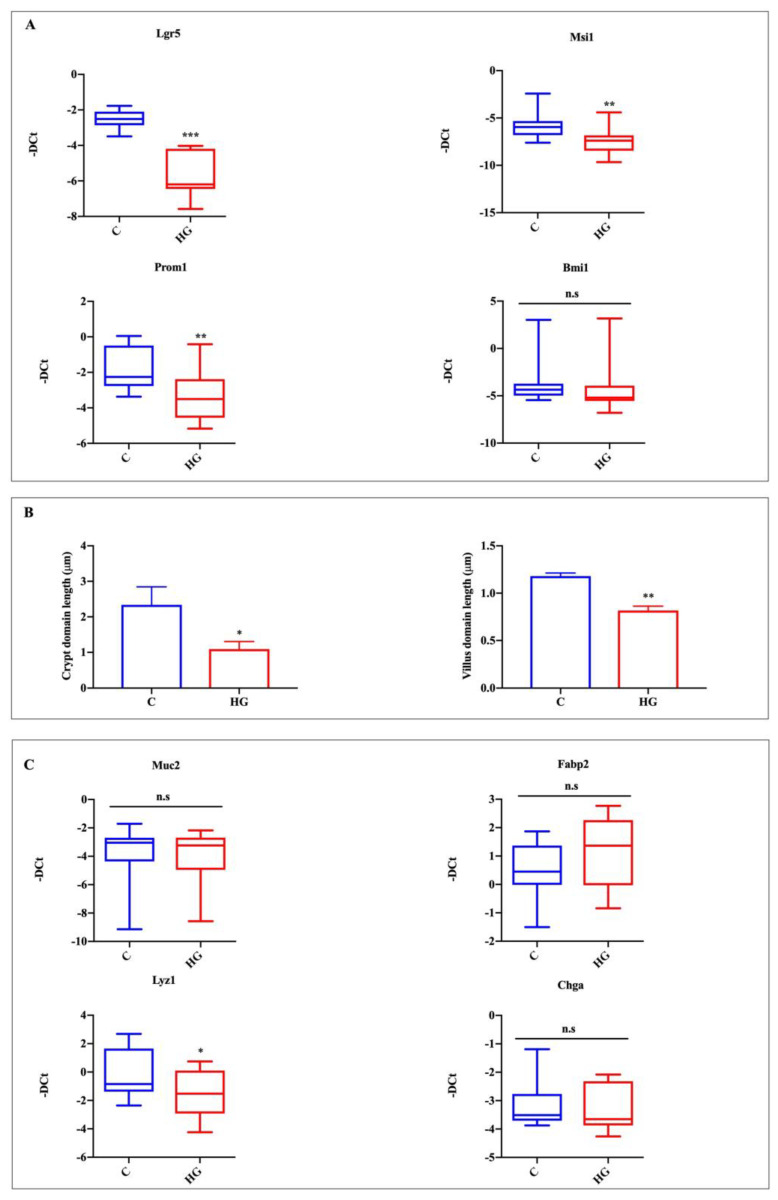
Figure 3.
Action of high glucose exposure on intestinal organoid proliferation and specific intestinal epithelial lineage marker expression. Lgr5 and Msi1, proliferating cells, and stem cells; Prom1, TA cells; Bmi1, +4 cells (A); crypt domain length and villus domain length (B); Muc2, goblet cells; Fabp2, enterocytes; Lyz1, Paneth cells; ChgA, EECs (C). Data generated from three biological replicates from five mice. Unpaired Student t-test: * p < 0.05, ** p < 0.01, *** p < 0.001; n.s. not significant. C = Control (17.5 mM glucose). HG = High Glucose (35 mM glucose).

