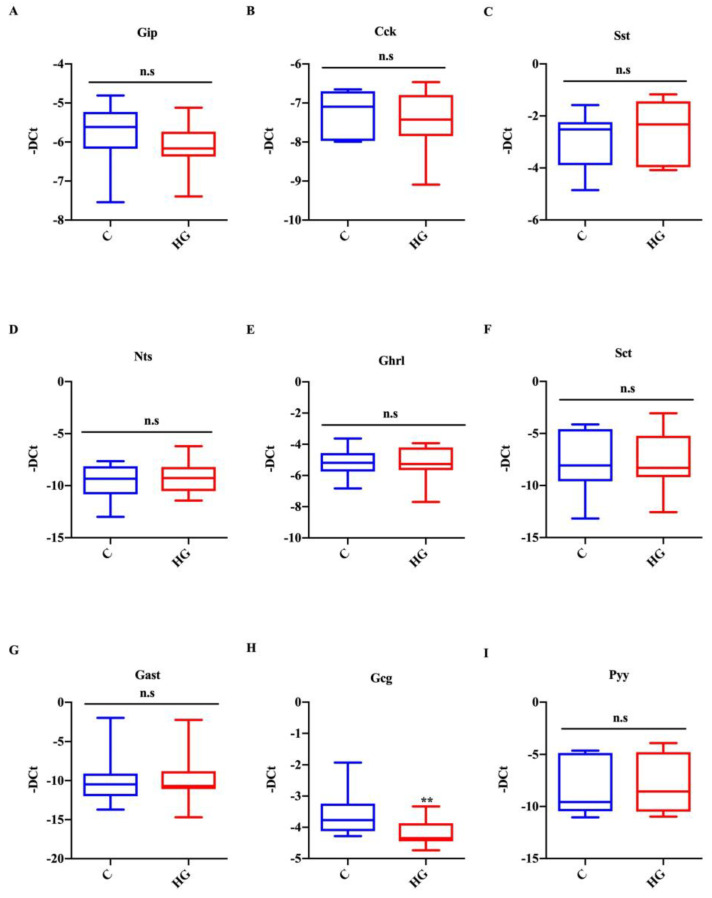
Figure 5.
Action of high glucose treatment on EEC markers. Expression of Gip (A), Cck (B), Sst (C), Nts (D), Ghrl (E), Sct (F), Gast (G), Gcg (H), and Pyy (I) in intestinal organoids exposed to high glucose (35 mM) for 48 h. Data generated from three biological replicates from five mice. Unpaired Student t-test: ** p < 0.01; n.s. not significant. C = Control (17.5 mM glucose). HG = High Glucose (35 mM glucose).

