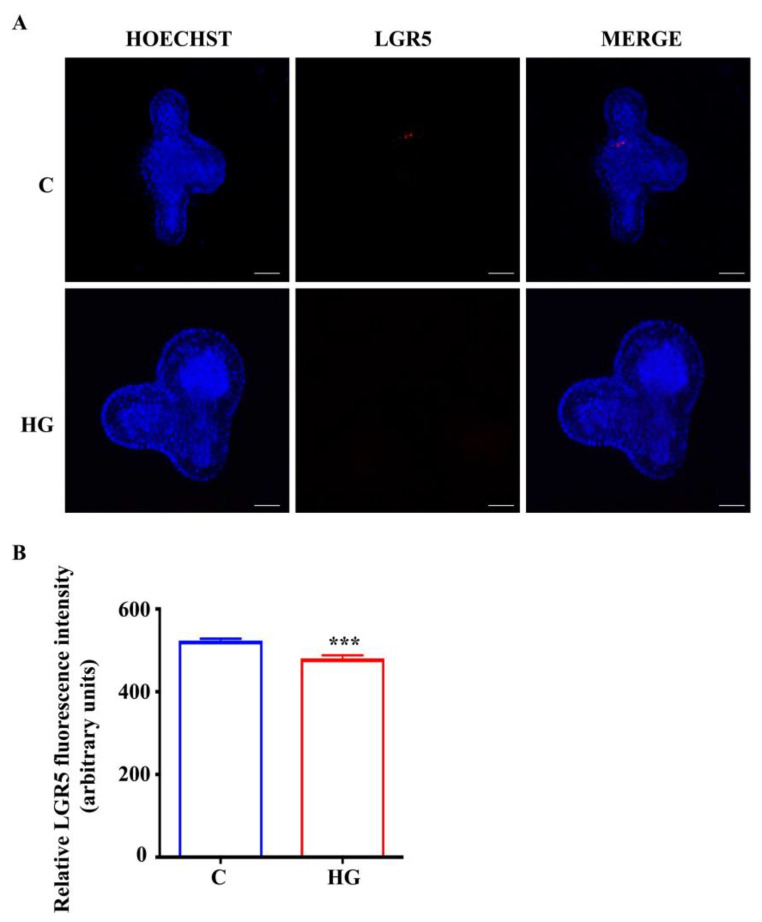
Figure 7.
Expression of LGR5 in small intestinal organoids. (A) Representative images of controls and organoids treated with high glucose (35 mM) for 48 h. Intestinal stem cells, inside organoids, are labeled in red by LGR5 expression. Nuclei are labeled by Hoechst. Scale bar, 50 μm. (B) Quantification of the LGR5 fluorescence intensity. (n = 6). Data are expressed as means ± SEM. Unpaired Student t-test: *** p < 0.001. C = Control (17.5 mM glucose). HG = High Glucose (35 mM glucose).

