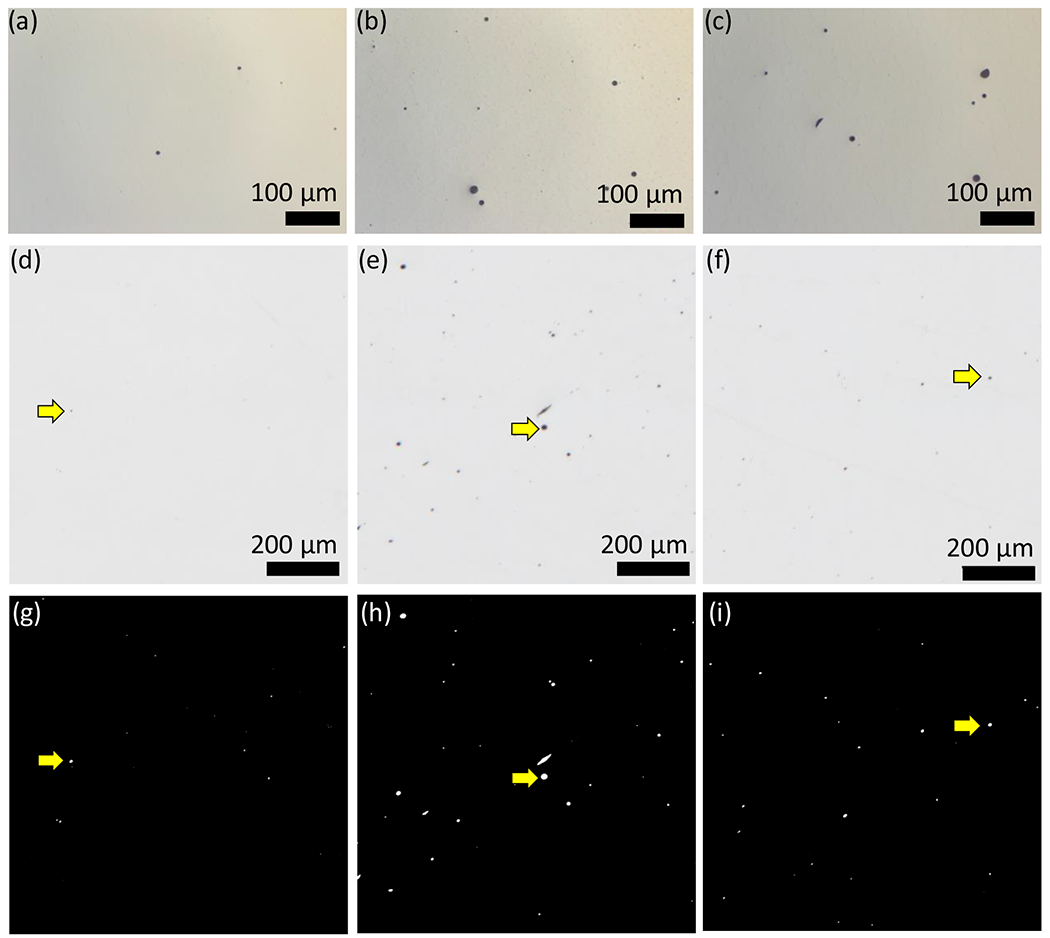
Fig. 10.

Exemplar optical images for polished cross-sections. Columns left to right correspond to Fine, Medium, and Coarse, respectively. Images (a-c) are from the Z-plane showing primarily spherical pores. Images (d-f) are a sample of the images used for optical porosity measurements (from X-plane, see Section 2.3) with their corresponding segmented images (g-i) with white regions identified as pores. The scale bar for segmented images is the same as (d-f).
