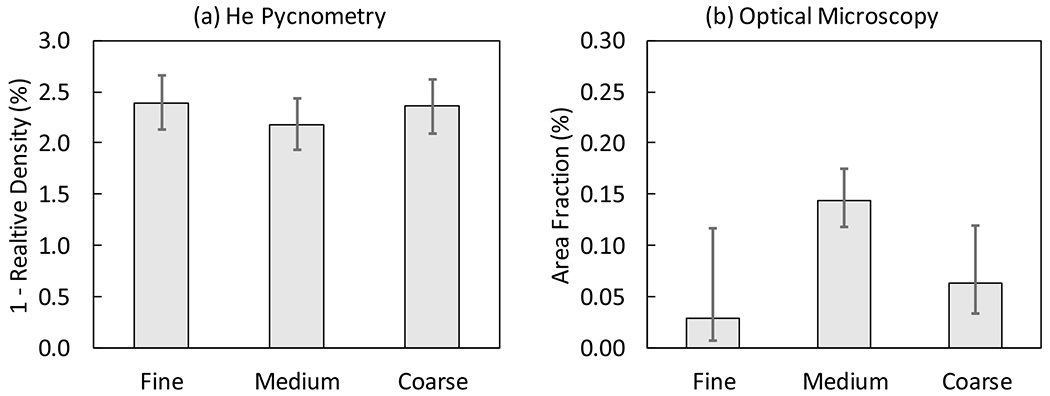
Fig. 11.

Average porosity measurements from (a) He pycnometry and (b) optical microscopy. Notice that there is an order of magnitude difference between the two measurement types. Confidence interval estimates are for p = 95 % and n = 3. A theoretical density of 7.8 g cm−3 was assumed.
