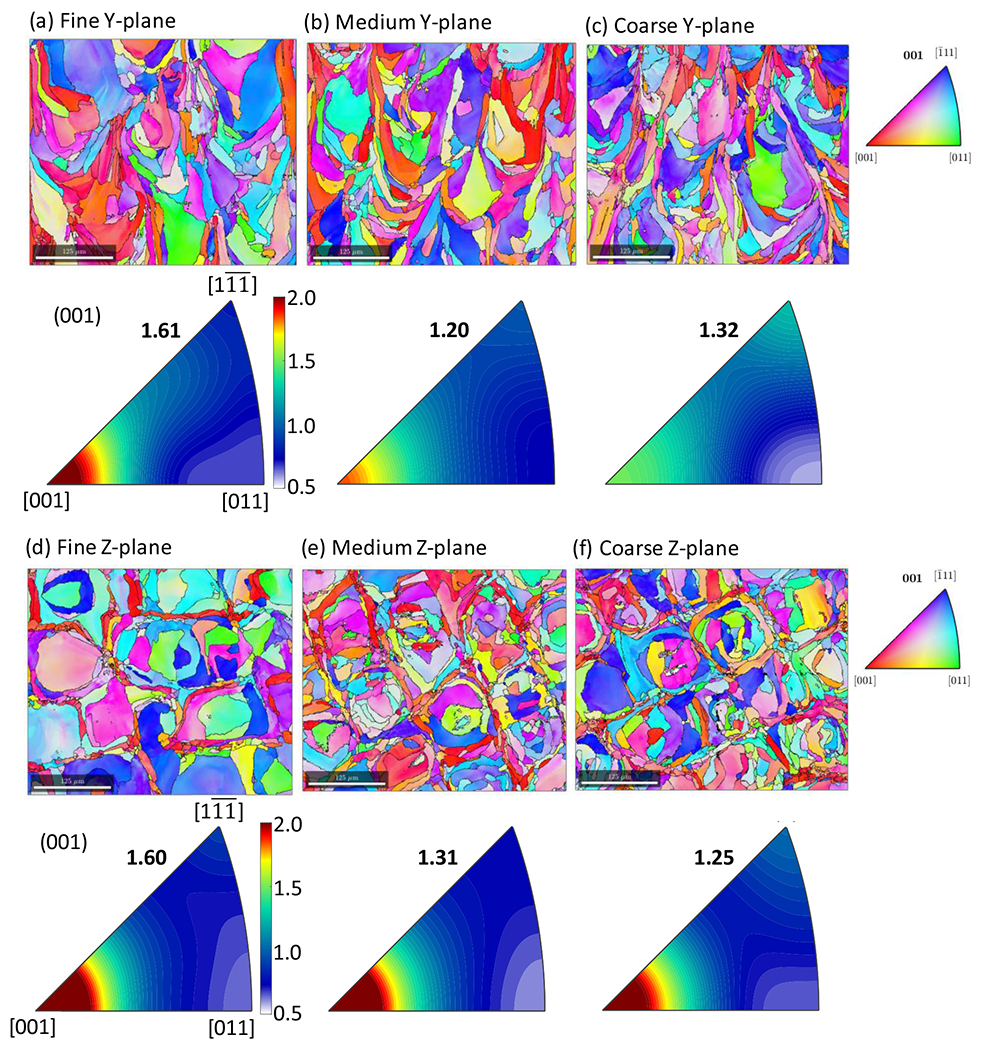
Fig. 12.

EBSD inverse pole figure (IFP) maps and corresponding texture for (a) Fine Y-plane, (b) Medium Y-plane, (c) Coarse Y-plane, (d) Fine Z-plane, (e) Medium Z-plane, and (f) Coarse Z-plane. Grain colors for all maps and texture analysis is based on the crystal plane normal that aligns with the build direction (Z-plane). Scale bars are 125 μm. Corresponding texture IPFs have units of multiples of a uniform distribution (m.u.d.). The texture index is listed for each case, which has a coefficient of variation of 7 % based on four scans on the Medium Y sample. Step size was 700 nm.
