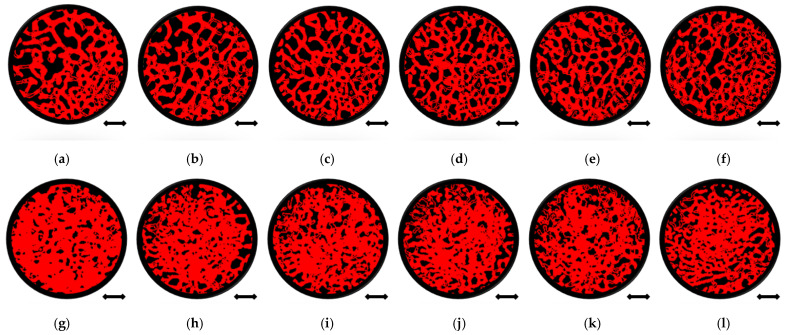
Figure 4.
Quantitative micro-CT analysis of femoral head bone samples microarchitecture before and after mechanical embedding of the MSC-Scaffold prototype. Views of bone samples cross-sections below of the reference plane: before the MSC-Scaffold embedding (a) 0 mm, (b) 0.5 mm, (c) 1 mm, (d) 1.5 mm, (e) 2 mm, (f) 2.5 mm, and after MSC-Scaffold embedding (g) 0 mm, (h) 0.5 mm, (i) 1 mm, (j) 1.5 mm, (k) 2 mm, (l) 2.5 mm; bar = 2 mm.

