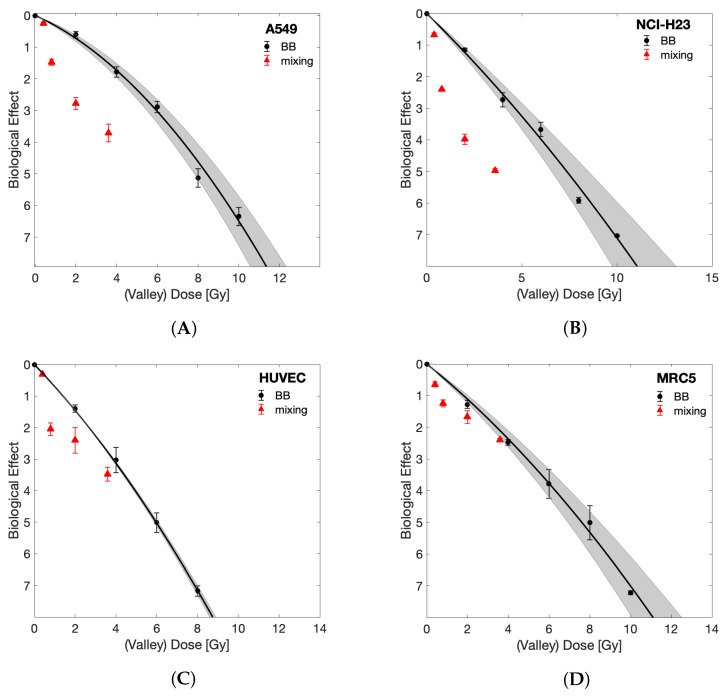
Figure 5.
Comparing the biological effect of BB against the valley dose of dose mixing experiment. Dose mixing surviving fractions were divided by 0.8 to account for only 80% of cells receiving the valley dose. BB results are shown with the relevant LQ-model fit (shaded areas indicate 95% confidence intervals). Survival curves are shown for tumour (A) A549, (B) NCI-H23 and normal (C) HUVEC and (D) MRC-5 cell lines.

