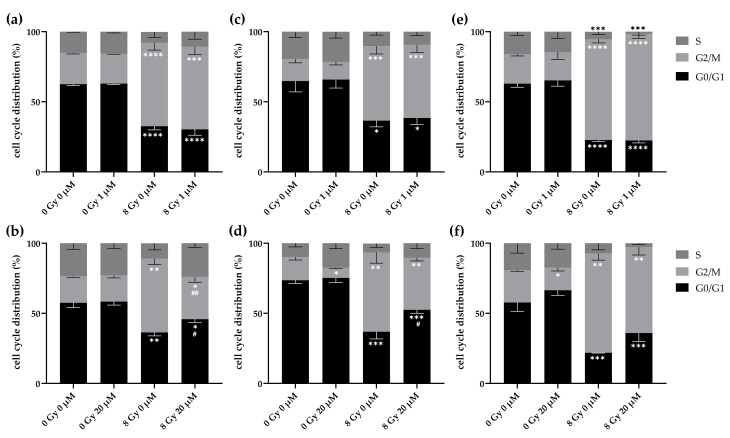
Figure 6.
G2/M cell cycle phase was significantly decreased by 8 Gy ionizing radiation combined with 20 µM lomeguatrib. (a) and (b) show LN18, (c) and (d) show T98G, and (e,f) show U118 cell cycle distribution 24 h after irradiation. Bars present the mean values, and error bars the standard deviation of at least three replicates. Asterisks indicate significances of the different treatments versus the 0 Gy 0 µM lomeguatrib sample of the respective cell cycle phase (Student’s t-test; * p 0.05, ** p 0.01, *** p 0.001, **** p 0.0001), while hash symbols represent significances between 0 Gy 0 µM to 0 Gy 1 µM or 20 µM and 8 Gy 0 µM to 8 Gy 1 µM or 20 µM.(Student’s t-test; # p 0.05, ## p 0.01).

