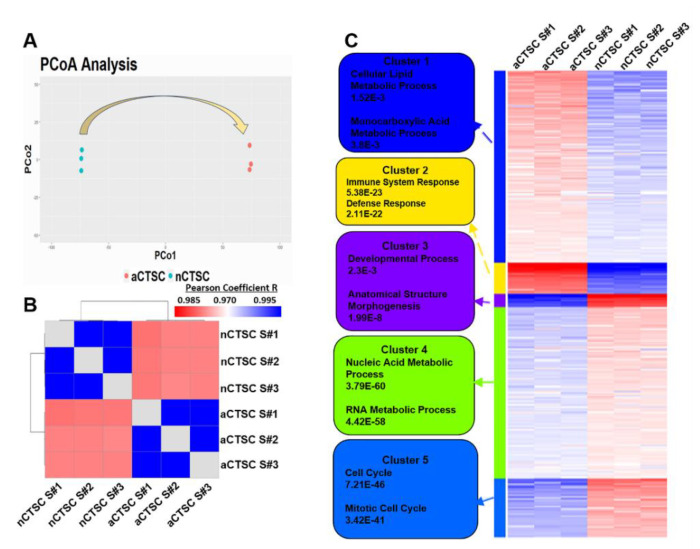
Figure 2.
Distinct processes present in each cluster through Gene Ontology (GO) enrichment. (A) Principal coordinates analysis of transcriptomic data comparing the two samples. (B) Correlation matrix compares nCTSC with aCTSC using Pearson correlation coefficient. (C) Heatmap visualizing five clusters distinctly identified using elbow method and subjected to GO enrichment.

