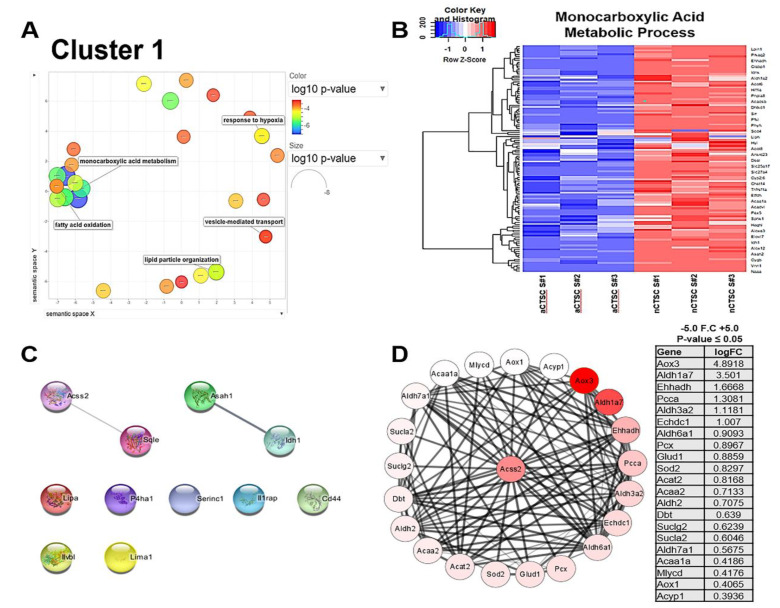
Figure 4.
Metabolic processes in cluster 1 related to ACSS2. (A) REVIGO analysis of cluster 1 visualizing similar GO terms grouped together in semantic space. (B) Heatmap of GO terms: monocarboxylic acid metabolic process. (C) Top 10 genes present in cluster 1 identified by STRING database and visualized through Cytoscape to show potential interaction with ACSS2. (D) Protein–protein interaction network of genes from cluster 1 that directly interact with Acyl-CoA synthetase short-chain family member 2 protein (ACSS2). Color of each protein ranges from white to red and corresponds to each gene logFC.

