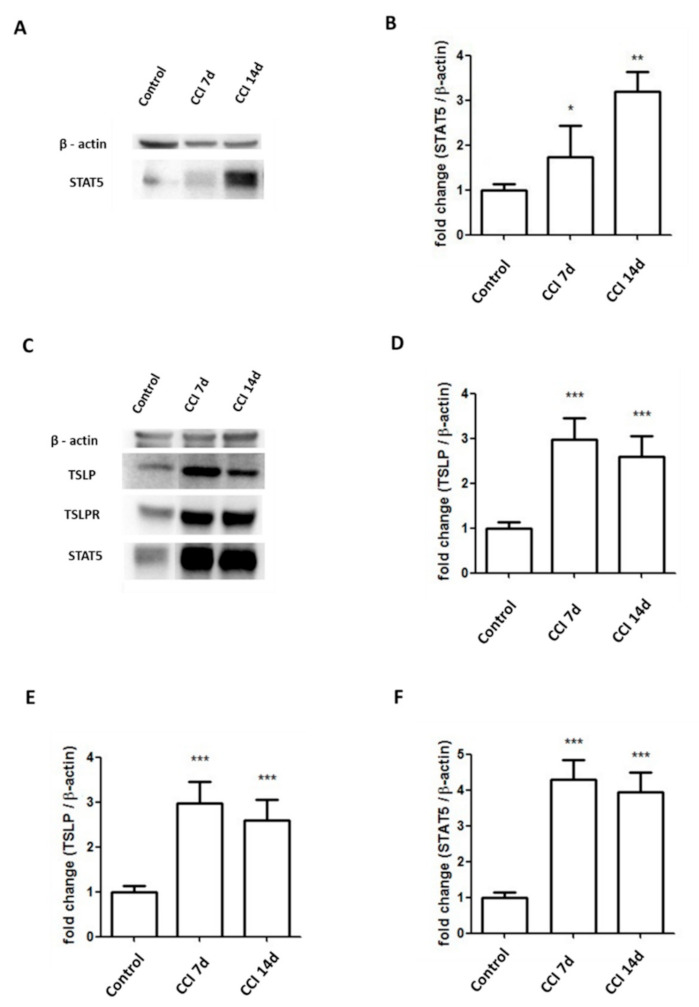
Figure 5.

Expressions of STAT5 increased in sciatic nerve and DRGs in CCI rats. (A,B) Levels of STAT5 in the L4/5 DRGs of rats increased at 7 days and 14 days after CCI. Representative Western blot results. Each band density was quantitated, normalized with its own β-actin. (C–F) Levels of TSLP, TSLPR, STAT5 in the sciatic nerve of rats increased at 7 days and 14 days after CCI. Representative Western blot results. Each band density was quantitated, normalized with its own β-actin. Values are presented as means ± SEM. N = 6 for each group. * p < 0.05, ** p < 0.01 and *** p < 0.001 vs. control group analyzed by ANOVA test.
