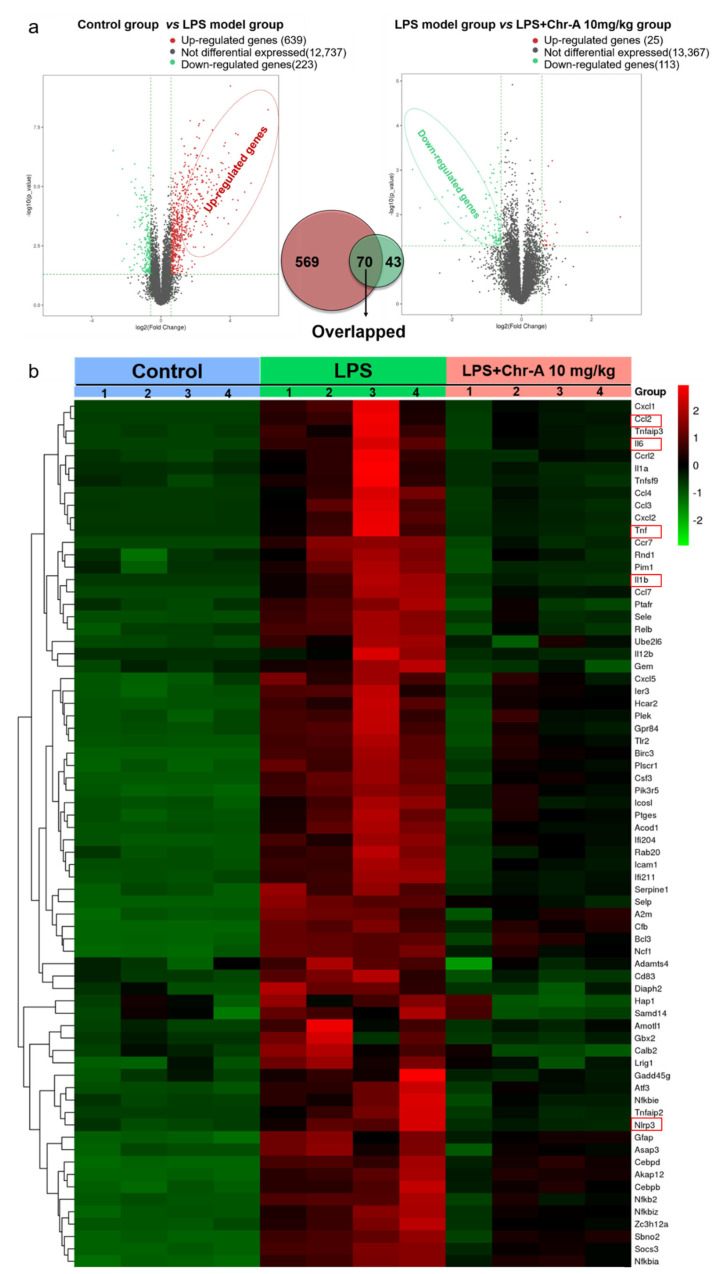
Figure 2.
RNA sequencing analysis of differential genes. Volcano map analysis of all DEGs in control group, LPS model group and LPS + Chr-A 10 mg/kg group (n = 4) (a). Seventy overlapping genes of three groups are shown in the heat map. In this diagram, red represents higher expression and green represents lower expression (b).

