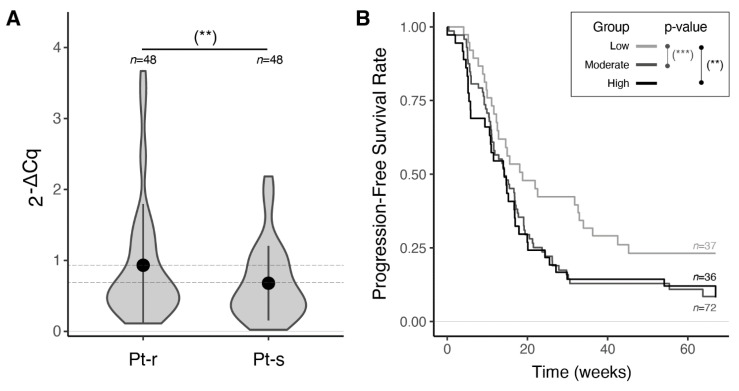
Figure 2.
Prognostic performance of miR-23a-3p in the Brescia cohort. (A) Violin plots and error bars (mean +/− standard deviation) showing normalized miR-23a-3p expression levels measured by RT-qPCR in HGSOC samples from platinum-resistant patients (Pt-r) compared to platinum-sensitive patients (Pt-s) (p-value = 0.03, one-sided t-test). Complete results in Table 4. (B) Progression-free survival curves (Coxph model adjusted by residual tumor, age and Bevacizumab), stratified by quartiles of normalized miR-23a-3p expression levels (Q1: low; Q2–Q3: moderate; Q4: high). Complete results in Supplementary Results Table S4. (**) p ≤ 0.05, (***) p ≤ 0.01.

