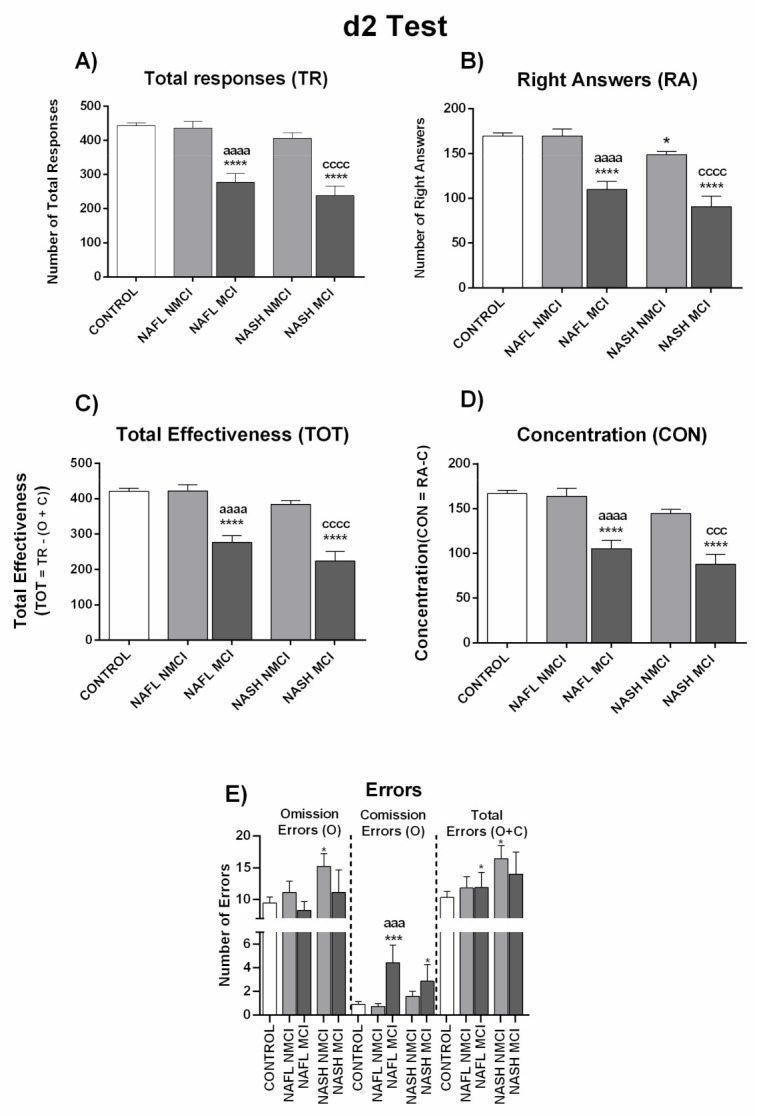
Figure 6.

Performance of NAFL and NASH patients classified by the new score as with (MCI) or without (NMCI) mild cognitive impairment in d2 test. (A) Number of total responses (TR), (B) right answers (RA), and (C) total effectiveness (TOT), which was calculated by: TOT= TR − (O + C) (D) Concentration index (CON), which was calculated by: CON = RA − C. (E) Number of errors by Omission (O), Comission (C), and total errors (O + C). Results are the mean ± SEM. * p < 0.05; *** p < 0.001; **** p < 0.0001 vs. control group (CNT), aaa p < 0.001; aaaa p < 0.0001, NAFL MCI vs. NAFL NMCI; ccc p < 0.001; cccc p < 0.0001, NASH MCI vs. NASH NMCI.
