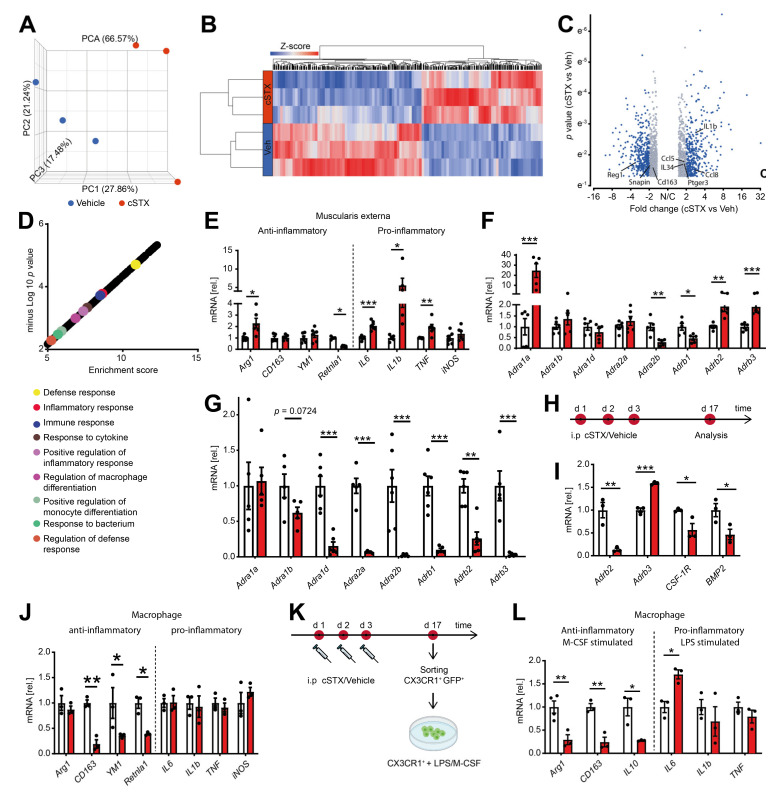
Figure 3.
6-OHDA treatment modifies the basal immune response of the small intestinal muscularis and alters the inflammatory state of CX3CR1+ MMs. (A) Representative data of one of the two independent experiments (n = 3 per group) showing the principal component analysis (PCA) of a bulk RNA sequencing analysis from muscularis externa specimens of vehicle- (blue) and cSTX-treated animals (red). (B) Heat map analysis of differentially expressed genes showed the hierarchical clustering between vehicle- and cSTX-treated mice. (C) Volcano plot of differentially expressed genes, of which 775 were upregulated and 965 were downregulated in the cSTX-treated group as compared to the vehicle-treated group (p < 0.05, fold change ± 2). (D) Functional enrichment of immune-related GO terms. (E) qPCR analysis from vehicle- (white) and cSTX-treated mice (red) showing the levels of pro- and anti-inflammatory genes in the muscularis externa (n = 6). (F,G) qPCR analysis from vehicle- (white) and cSTX-treated mice (red) showing the altered gene expression of adrenergic receptors in the muscularis externa (n = 6) (F) and mucosa (n = 6) (G). Values in each column (E,G) are shown as mean ± SEM and statistical analysis was carried out by unpaired t-test (* p < 0.05, ** p < 0.01 and *** p < 0.001) comparing vehicle-treated mice versus indicated groups. (H) The experimental setting for sorting CX3CR1+ cells from intestinal muscularis externa, 17 days after vehicle or cSTX intraperitoneal (i.p) treatment. (I,J) mRNA expression (n = 3) of sorted macrophage receptors and cytokines from vehicle- (white) and cSTX-treated mice (red). (K) The experimental setting of an ex vivo LPS/M-CSF stimulation of sorted CX3CR1+ cells 17 days after vehicle or cSTX treatment. (L) qPCR analysis (n = 6) of sorted CX3CR1+ cells from vehicle- (white) and cSTX-treated mice (red) treated with LPS/M-CSF showing the levels of anti- and pro-inflammatory genes. Values in each column are shown as mean ± SEM, and statistical analysis was carried out by unpaired t-test (* p < 0.05, ** p < 0.01 and *** p < 0.001) comparing vehicle-sorted macrophages versus indicated groups (I,J,L).

