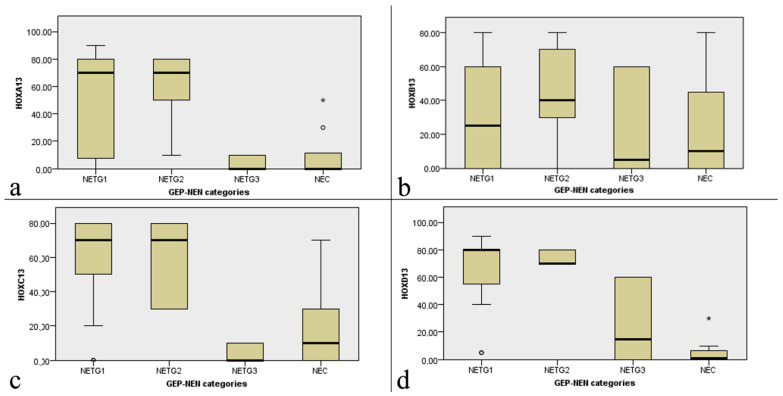
Figure 2.
Box plot representation of the relation between paralogous 13 HOX genes expression and GEP- NEN categories (NETG1, NETG2, NETG3, NECG3): (a) HOXA13; (b) HOXB13; (c) HOXC13; (d) HOXD13. Each value that deviates from the central trend of the distribution is represented in the graph with the symbol °/*.

