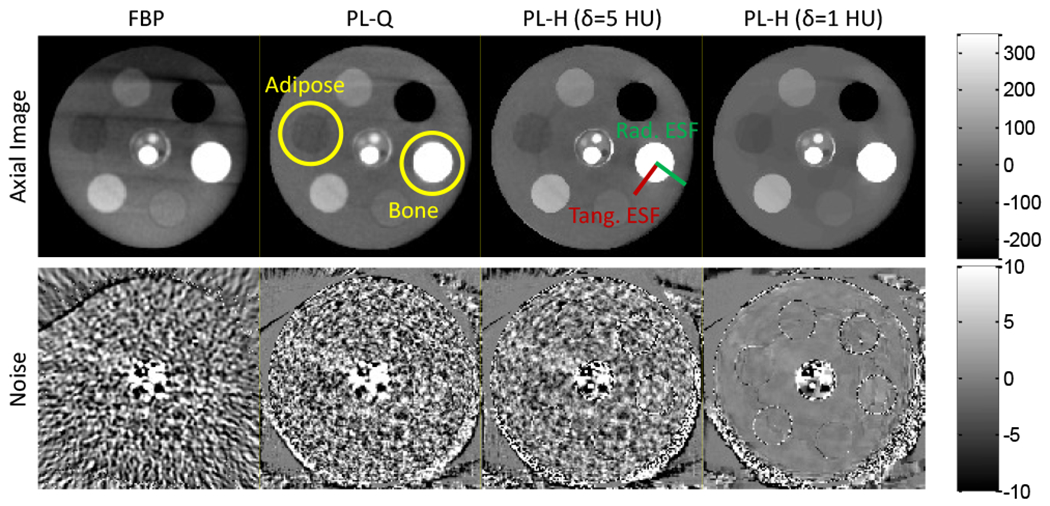
Fig. 6:

Axial slices of a cylindrical phantom for various reconstruction methods. (Top) Axial images. (Bottom) Noise maps computed from the difference of non-adjacent slices. The low-contrast Adipose insert is marked at the ~9:00 position, while high-contrast Bone is marked at ~3:00. The FBP and PL variants show differences in noise magnitude, correlation, and stationarity. The examples shown have a cutoff frequency (fc) and regularization (β) such that the adipose ESF is matched at 1.1 mm.
