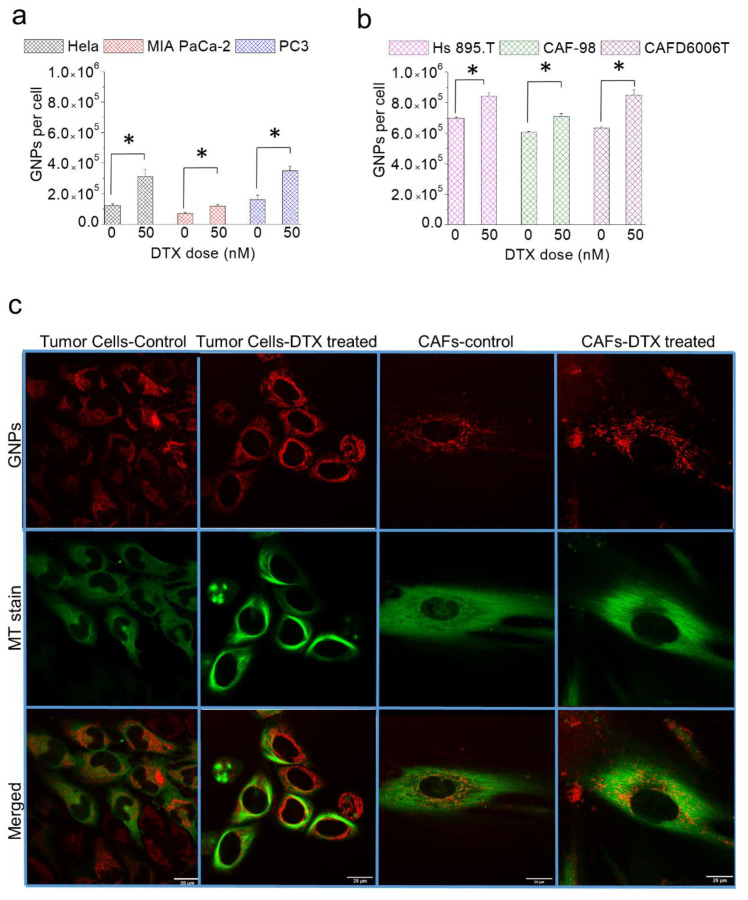
Figure 6.
Effect of DTX on GNP. (a,b) The number of GNPs present in tumor cells and CAFs after a 24 h incubation with GNPs/DTX vs. GNPs alone, respectively. * indicates p < 0.05 (c) Confocal Images of tumor cells and CAFs treated and untreated with DTX. GNPs are in red (first row), MTs are in green (second row), and merged are in red and green (third row). The first column demonstrates the distribution of GNPs in cancer cells in the absence of DTX. The second column demonstrates the effect of DTX on MTs and on the distribution of GNPs in cancer cells. The third and fourth columns show the effect of the absence and presence of DTX on the number of GNPs in CAFs, respectively. Scale bar = 20 μm.

