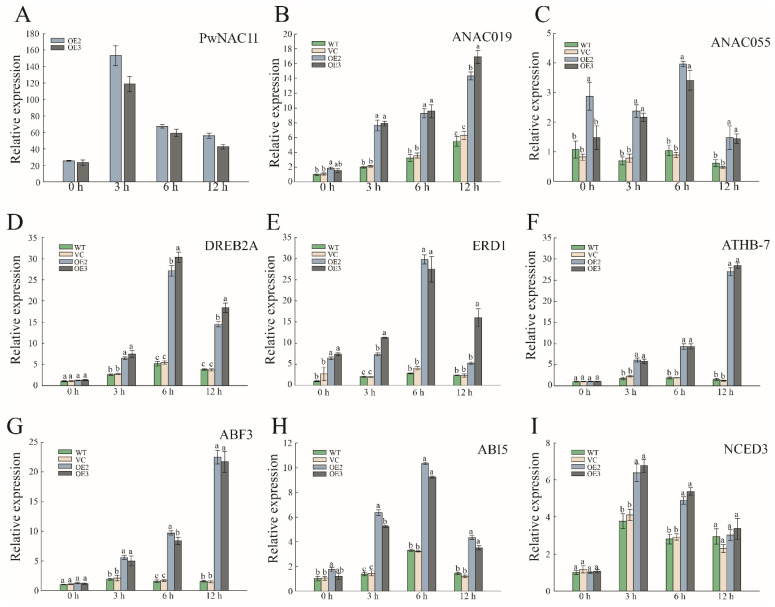
Figure 5.
Expression profiles of some stress-responsive genes and ABA-responsive genes after PEG treatment. (A–I) Expression profiles of these genes in OE, WT, and VC lines under simulated drought conditions. The data are represented as means ± standard error from three independent replications. Different letters indicate significant differences at p-value < 0.05.

