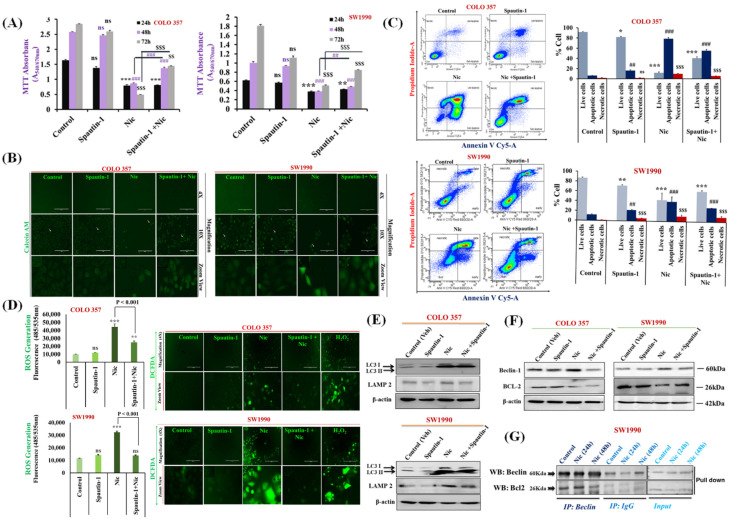
Figure 4.
Nic-induced autophagy leads to PC cell death by disrupting Beclin1–BCL2 interaction. (A) Effect of functional blockage of autophagy via spautin-1 on Nic-treated PC cells resulted in growth promotion. COLO 357 and SW1990 cells were pretreated with spautin-1 for 2 h, followed by Nic (10 µM) for 24, 48, and 72 h and cell viability was assessed by MTT assay. Values are expressed as mean ± SEM (n = 3), p values: *** p < 0.001, ** p < 0.01 vs. control (24 h); p values: ### p < 0.001, ## p < 0.001 vs. control (48 h); p values: $$$ p < 0.001, $$ p < 0.001 vs. control (72 h). (B) Representative images showing the Calcein-AM-stained cells, original magnification 4×; 10×. (C) Protective effect of autophagy inhibition on Nic-induced apoptosis was determined by flow cytometric analysis of PC cell lines after staining with annexin-V Cy-5/PI (AV+/PI—intact cells; AV/PI+—nonviable/necrotic cells; AV+/PI and AV+/PI+—apoptotic cells) in different groups, i.e., spautin-1, Nic and combination of Spautin-1 and Nic (left panel). Quantitative analysis of these micrographs was shown as mean ± SEM, p values: *** p < 0.001, ** p < 0.01, * p < 0.05 vs. live control cells; ### p < 0.001, ## p < 0.001 vs. apoptotic control cells; $$$ p < 0.001 vs. necrotic cells (right panel). (D) Intracellular ROS levels in cells treated with spautin-1, Nic and their combination were evaluated using DCFDA fluorogenic dye (10 µM for 30 min) by measuring fluorescence at 485/535 nm (excitation/emission) using a fluorescent plate reader (left panel). The results are expressed as relative fluorescence intensity units. Values are expressed as mean ± SEM (n = 3), p values: *** p < 0.001, ** p < 0.01 vs. control. Fluorescence imaging was performed in these cells stained with DCFDA (right panel), original magnification 4×. (E,F) Representative western blot images showing the expression of LC3I/II and LAMP2 (E); Beclin-1 and BCL2 (F) in COLO 357 and SW1990 cells treated with spautin-1, Nic and their combination. Membrane was stripped and re-probed with β-actin to correct for loading control. (G) Representative western blot images showing the expression of Beclin-1 and BCL2 in cells treated with Nic (10 µM; 24 and 48 h) and lysates were immunoprecipitated with Beclin-1 antibody and analyzed by western blotting for BCL2 interaction.

