
Figure 3.
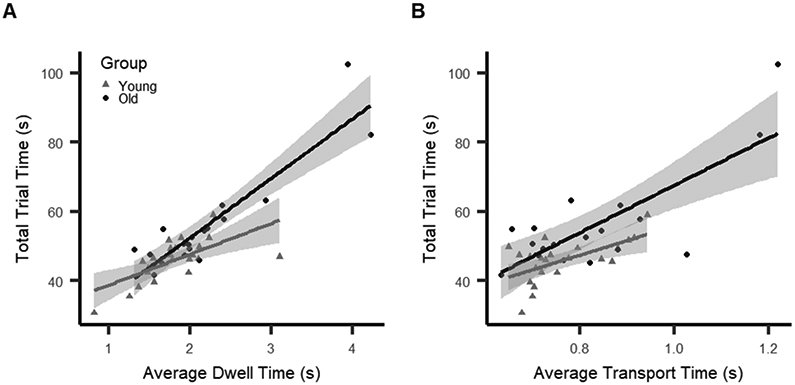
Interactions between age group and motor phase (fine motor phase = dwell time; gross motor phase = transport time) as predictors of overall trial time (task performance). Color of points indicates age group and color of lines models the interaction effect on average time spent in each phase based on age group. Shaded area represents standard error. A) The relationship between average dwell time and total trial time is different for young and older age groups. B). The relationship between average transport time and total trial time is comparable for young and older age groups.