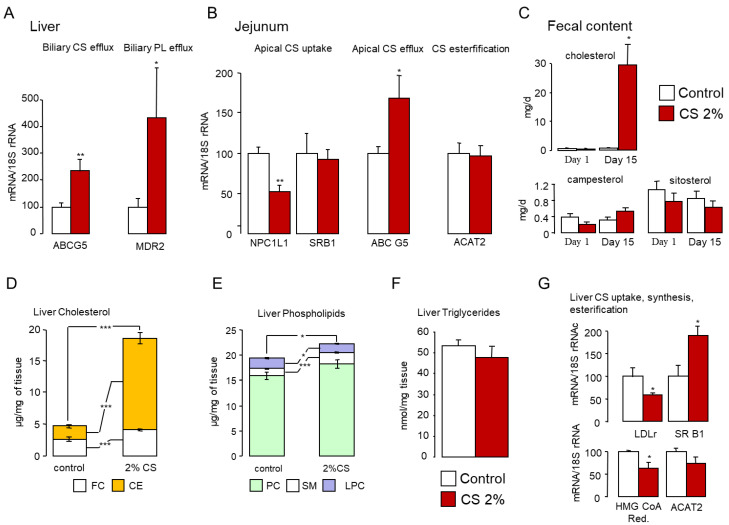
Figure 9.
Fecal cholesterol excretion is increased in cholesterol-fed mice. (A,B) mRNA levels of sterol and phospholipids transporters in the liver (A) and the jejunum (B) of standard diet (control) or 2% cholesterol-fed (2% CS) mice. (C) Excretion of cholesterol and phytosterols in the feces of control and 2% cholesterol-fed mice. (D) Cholesterol, (E) phospholipid, (F) triglyceride levels in the liver of control and 2% cholesterol-fed mice. (G) mRNA levels of key lipoprotein receptors and cholesterol processing enzymes in the liver of control and 2% cholesterol-fed mice. Bar graphs represent mean ± s.e.m (n = 8 per group). * p < 0.05, ** p < 0.01, *** p < 0.001 determined by Student’s t-test with Welch’s correction.

